Don’t invest unless you’re prepared to lose all the money you invest. This is a high-risk investment and you are unlikely to be protected if something goes wrong. Take 2 minutes to learn more
Trading activity in the ANKR/USDT daily market started on a strong note. However, price forces have acted on the market, pushing price action back below some key technical levels. Nevertheless, price action is hovering around an important threshold that could allow bullish forces to continue influencing the market.
Ankr Statistics
ANKR Current Price: $0.01784
Market Capitalization: $179.26M
Circulating Supply: 10B
Total Supply: 10B
CoinMarketCap Rank: 185
Key Price Levels
Resistance: $0.01800, $0.02000, $0.02200
Support: $0.01700, $0.01500, $0.01300
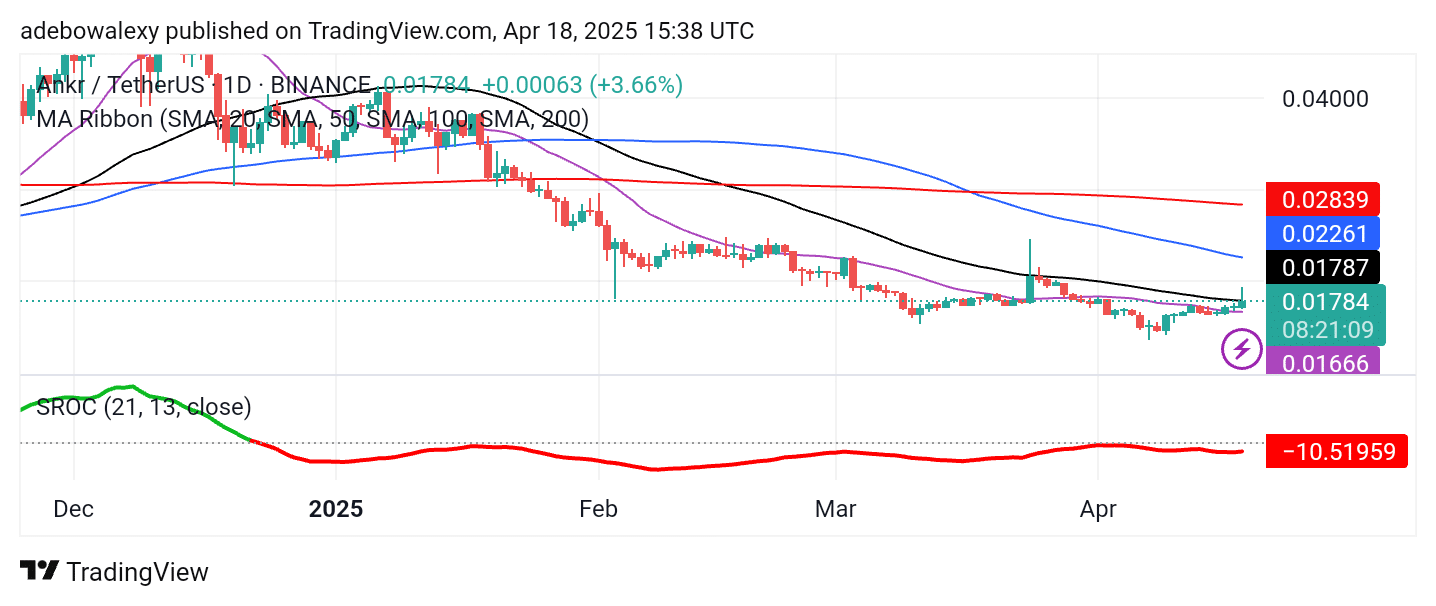
ANKR/USDT Market Stays on a Promising Path
Trading activity in the ANKR daily market saw a strong upward retracement earlier today. As noted, bullish forces appear to remain active despite a recent downward price contraction. Price action remains above the 20-day Moving Average (MA) line, while the upper shadow of the latest price candle pierced through the 50-day MA curve.
Meanwhile, the Stochastic Rate of Change (SROC) indicator remains below the equilibrium level but is taking on a slight upward slope. This suggests the potential for a modest bullish recovery shortly.
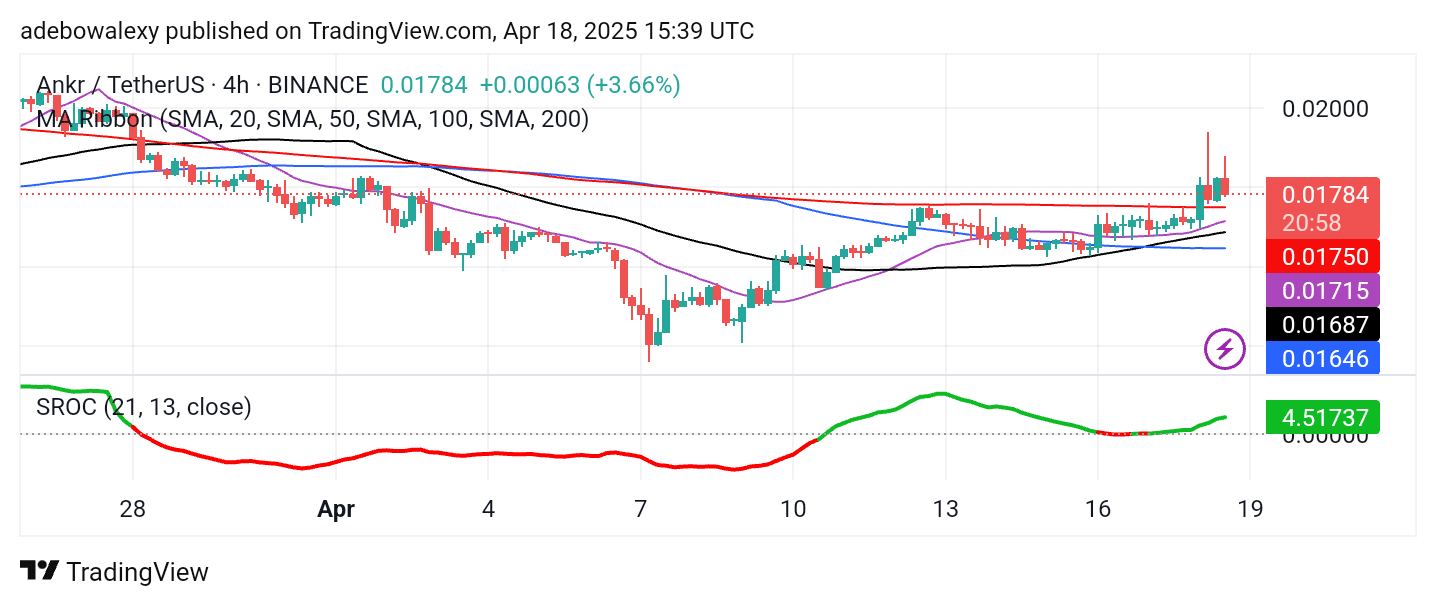
Ankr Downward Retracement May Be Shaken Off
While the ANKR/USDT market remains in the green on the daily chart, a significant downward retracement has been observed on the short-term chart. On the 4-hour chart, price activity has managed to move above all the MA lines.
Meanwhile, the current session has shown a moderate pullback. However, the SROC indicator lines are positioned above the equilibrium level and continue to follow an upward trajectory. Consequently, even on shorter timeframes, the market maintains a promising outlook. Therefore, traders may continue to target the $0.01900 level for short-term gains.
Make money without lifting your fingers: Start trading smarter today
- Broker
- Min Deposit
- Score
- Visit Broker

- Award-winning Cryptocurrency trading platform
- $100 minimum deposit,
- FCA & Cysec regulated

- 20% welcome bonus of upto $10,000
- Minimum deposit $100
- Verify your account before the bonus is credited
- Fund Moneta Markets account with a minimum of $250
- Opt in using the form to claim your 50% deposit bonus
Learn to Trade
Never Miss A Trade Again

Signal Notification
Real-time signal notifications whenever a signal is opened, closes or Updated

Get Alerts
Immediate alerts to your email and mobile phone.

Entry Price Levels
Entry price level for every signal Just choose one of our Top Brokers in the list above to get all this free.