Should the buyers gain enough momentum and the daily candle closes above $1.2 level, ADA/USD may increase to $1.4 – $1.6 levels. In case the sellers defend the $1.2 level, the bears’ pressure may likely reduce the price.
ADA/USD Market
Key Levels:
Resistance levels: $1.2, $1.4, $1.6
Support levels: $1.1, $0.8, $0.7
ADA/USD Long-term Trend: Bearish
ADA/USD is exhibiting a range-bound movement within $1.1 and $1.2 price level last week. The buyers gathered enough momentum to break up the resistance level of $1.1 and $1.2 on February 25; this is seen on the daily chart with the formation of strong bullish candles. The resistance level of $1.4 was tested many times but rejected by the bears’ pressure. It is currently ranging within the $1.2 and $1.1 price levels.
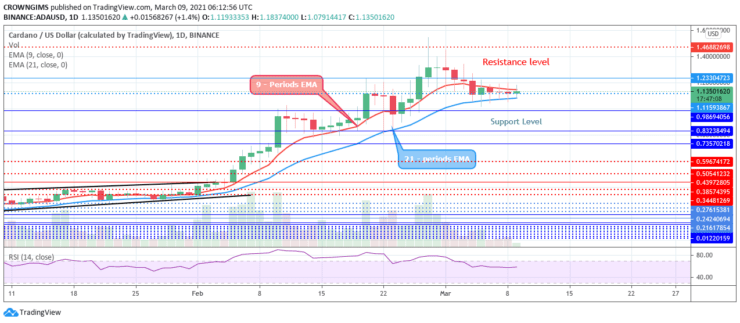
The coin is trading in between the 9 periods EMA and 21 periods EMA as a sign of ranging market. Should the buyers gain enough momentum and the daily candle closes above $1.2 level, ADA/USD may increase to $1.4 – $1.6 levels. In case the sellers defend the $1.2 level, the bears’ pressure may likely reduce the price. However, the next support levels can be found at $1.1, $0.8, and $0.7. The technical indicator RSI is above 50 levels with the signal line parallel to the level which indicates that consolidation is in progress.
ADA/USD Medium-term Trend: Ranging
Cardano is on the ranging mode in a 4-hour chart. The crypto is range-bound within the resistance level at $1.2 and the support level at $1.1; this scenario commenced on March 05 when the coin tested the resistance level of $1.2 and the level hold the price. Many attempts were made by the bulls to break up the resistance level of $1.2 but the bears were defending the level.
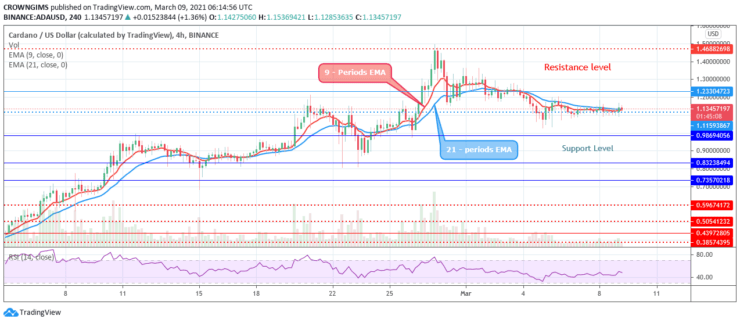
The two EMAs are interlocked to each other and the price is hovering over the 9 periods EMA and 21 periods EMA as a sign of consolidation while the relative strength index period 14 is at 50 levels and the signal line showing sell direction.
.
- Broker
- Min Deposit
- Score
- Visit Broker

- Award-winning Cryptocurrency trading platform
- $100 minimum deposit,
- FCA & Cysec regulated

- 20% welcome bonus of upto $10,000
- Minimum deposit $100
- Verify your account before the bonus is credited
- Fund Moneta Markets account with a minimum of $250
- Opt in using the form to claim your 50% deposit bonus
Learn to Trade
Never Miss A Trade Again

Signal Notification
Real-time signal notifications whenever a signal is opened, closes or Updated

Get Alerts
Immediate alerts to your email and mobile phone.

Entry Price Levels
Entry price level for every signal Just choose one of our Top Brokers in the list above to get all this free.