Don’t invest unless you’re prepared to lose all the money you invest. This is a high-risk investment and you are unlikely to be protected if something goes wrong. Take 2 minutes to learn more
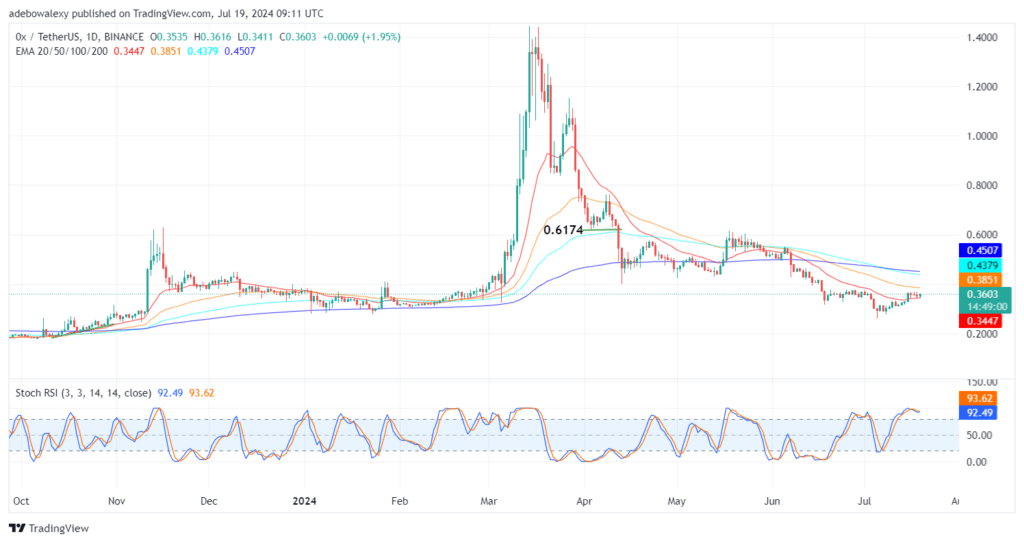
Price activity in the 0x daily market has risen past an important but short-term technical indicator line. However, the market continues to experience reduced volatility. This has significantly reduced the impact of upside forces in the market.
0x Statistics:
Current ZRX Price: $0.3601
0x Market Cap: $301,510,893
0x Circulating Supply: 847,496,055
ZRX Total Supply: 1,000,000,000
ZRX CoinMarketCap Rank: 173
Key Price Levels:
Resistance: $0.4000, $0.5000, and $0.6000 Support: $0.3000, $0.2000, and $0.1000

ZRX Sustains Above the $0.3500 Mark
The 0x price action rose through the 20-day Exponential Moving Average curve about 4 sessions ago. Nevertheless, headwinds have restricted upside progress, but the market continues to trade above the 20-day EMA line.
Meanwhile, the ongoing session has appeared green, and the Stochastic Relative Strength Index (SRSI) lines are still in the overbought region. Today’s minimal price upside rebound has caused the SRSI indicator lines to start approaching a crossover in the overbought region. Consequently, it appears that traders may fancy crypto signals targeting the next technical resistance at the $0.4000 price mark.

The 0x Market Still Appears Vulnerable
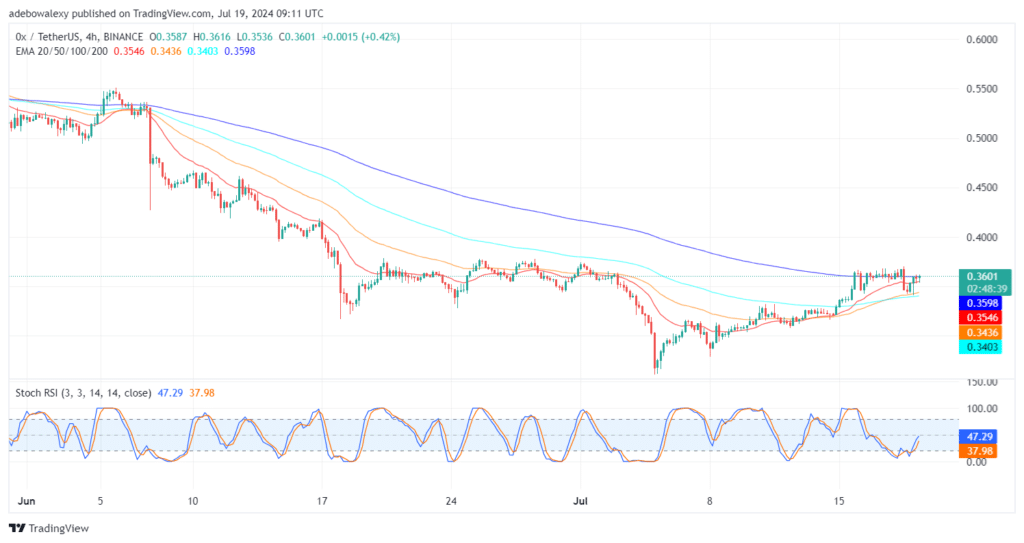
While the ZRX token still trades just above the 20-day EMA line on the daily chart, it can be seen that the 4-hour market has price action above all the EMA lines by a thin margin. The last price candle appears tiny and almost at the same level as the 200-day EMA curve. At the same time, the SRSI lines are generally still rising upward.
However, a very small deflection can be seen on the lines of this indicator, with the leading indicator line just testing the 50-day EMA line. Upside forces may advance towards the $0.4000 price level should the market rise further above the 200-day EMA line.
Start using a world-class auto trading solution.
- Broker
- Min Deposit
- Score
- Visit Broker
- Award-winning Cryptocurrency trading platform
- $100 minimum deposit,
- FCA & Cysec regulated
- 20% welcome bonus of upto $10,000
- Minimum deposit $100
- Verify your account before the bonus is credited
- Fund Moneta Markets account with a minimum of $250
- Opt in using the form to claim your 50% deposit bonus
Learn to Trade
Never Miss A Trade Again

Signal Notification
Real-time signal notifications whenever a signal is opened, closes or Updated

Get Alerts
Immediate alerts to your email and mobile phone.

Entry Price Levels
Entry price level for every signal Just choose one of our Top Brokers in the list above to get all this free.


