Don’t invest unless you’re prepared to lose all the money you invest. This is a high-risk investment and you are unlikely to be protected if something goes wrong. Take 2 minutes to learn more
ZKSync Price Forecast – March 10th
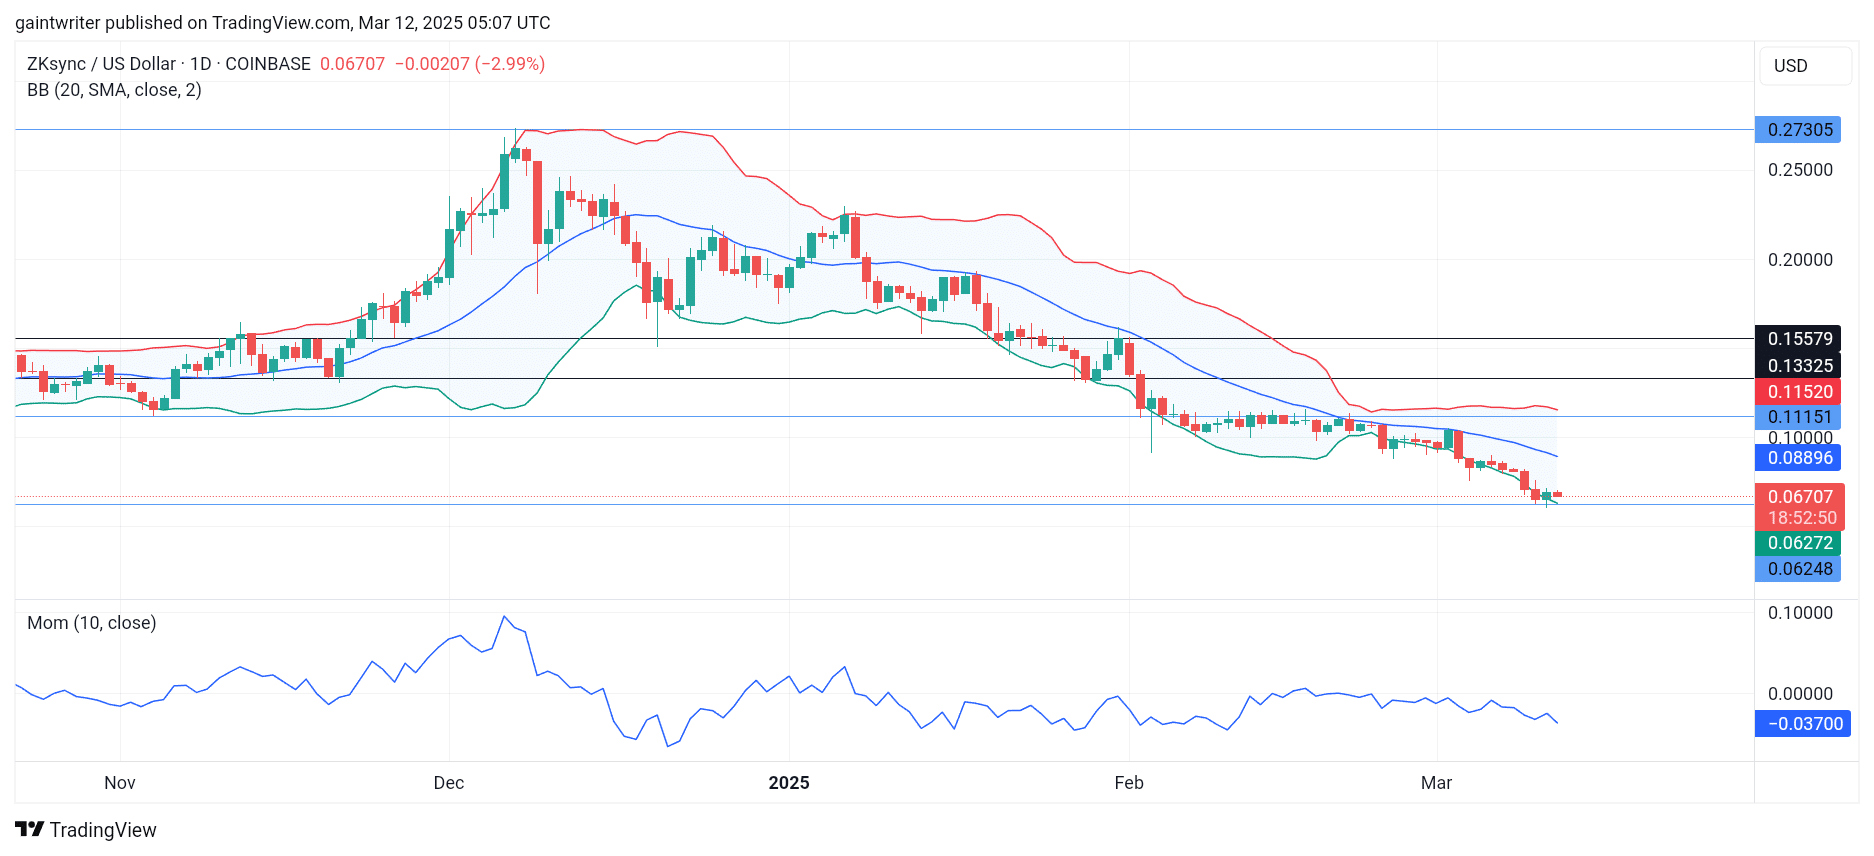
ZKSync forecast shows buyers are struggling to gain momentum, facing strong selling pressure and attempting to defend the $0.06240 significant level.
ZKUSD Key Levels:
Support Levels: $0.06240, $0.06200 Resistance Levels: $0.11000, $15600
ZKSync Long-Term Trend: Bearish (Daily Chart)
Early last month, ZKSync’s price fell below the $0.11000 key zone, indicating a shift in market sentiment. The price consolidation around this zone for several weeks suggests a period of uncertainty, followed by a decisive move by sellers.
ZKSync Price Forecast – ZKUSD Outlook
The expansion of the Bollinger Bands in early March signalled increased selling pressure, leading to a further decline towards the $0.06200 level. The inability of buyers to sustain a recovery from this level highlights the strength of the bearish trend.
The Momentum indicator’s decline reflects the sustained selling pressure. The persistence of this downward trend suggests that sellers are maintaining control. The daily chart candlestick patterns should be monitored for bearish continuation patterns, such as consecutive red candles or bearish engulfing patterns.
The current market dynamic indicates that sellers are aiming to push prices below the $0.06240 support level. The Bollinger Bands are showing signs of potential further expansion, indicating increased volatility and potential for further price declines. The declining Momentum indicator reinforces the bearish outlook, signalling a lack of buying interest.
ZKUSD Medium Term Trend: Bearish (4-hour chart)
In the short time frame, the Momentum indicator continues to show a downward trend, indicating sustained selling pressure. This suggests that sellers are likely to maintain control in the near term.
A break below the $0.06240 support level could trigger further selling, potentially leading to a more significant price decline. The focus should be on the bollinger bands, and the momentum indicator for continued bearish signals.
Note: Learn2.trade is not a financial advisor. Do your research before investing your funds in any financial asset, product, or event. We are not responsible for your investment results.
Trade on MT4 with Leverage up to 1:500! Trade on MT4 with Leverage up to 1:500!
X
We use cookies to ensure that we give you the best experience on our website. If you continue to use this site we will assume that you are happy with it.