XRP/USD Market October 25
The price can break down the dynamic support levels which may lead to the price decrease to the $0.23 level, further increase in the bears’ pressure may place the price at $0.22 and $0.21 support levels. In case the dynamic support levels hold the price, the bullish trend may continue to the resistance levels at $0.27 and $0.29.
Key Levels:
Resistance levels: $0.25, $0.27, $0.29
Support levels: $0.23, $0.22, $0.21
XRP/USD Long-term Trend: Bearish
The bullish momentum in the daily chart is getting weak. The coin increases to the resistance level at $0.25 on October 22. The bulls’ momentum seems to be weak and the bears take over the market; this is confirmed with the formation of daily bearish candles. The scenario is declining the price to test the dynamic support level. Yesterday, the XRP price increases by 0.61%. Today, it is currently decreasing by – 1.48%.
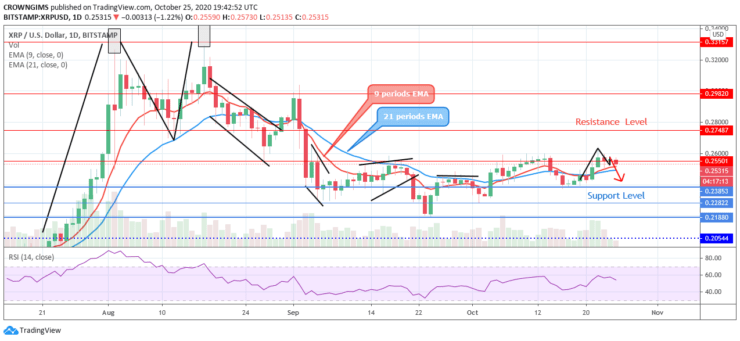
XRP is testing the dynamic support level of 9 periods EMA, trying to penetrate the two EMAs. However, the price is trading above the two EMAs. The price can break down the dynamic support levels which may lead to the price decrease to the $0.23 level, further increase in the bears’ pressure may place the price at $0.22 and $0.21 support levels. In case the dynamic support levels hold the price, the bullish trend may continue to the resistance levels at $0.27 and $0.29. The relative strength index period 14 is bending down at 50 levels which indicates a sell signal.
XRP/USD medium-term Trend: Bearish
XRPUSD is bearish on the 4-hour chart. The bears opposed the price increase at the $0.27 zone with the formation of an evening star candle pattern. The mentioned candle pattern is a bearish pattern and the coin obeys the bears’ pressure. The Price is currently declining towards the support level at $0.23.
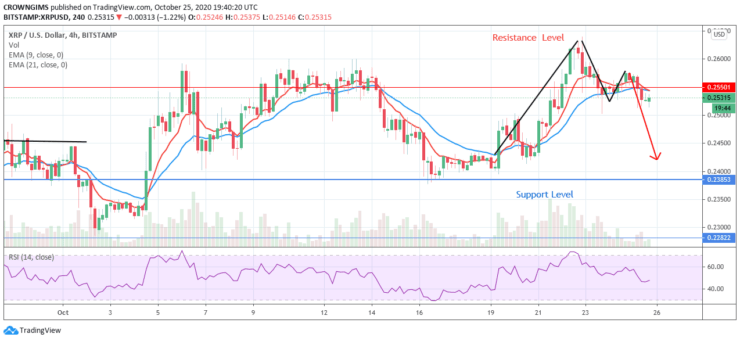
XRP has crossed the 9 periods EMA and the 21 periods EMA downside and it is trading below the two EMAs. However, the relative strength index period 14 is pointing down at 50 levels which indicates further price reduction.
- Broker
- Min Deposit
- Score
- Visit Broker

- Award-winning Cryptocurrency trading platform
- $100 minimum deposit,
- FCA & Cysec regulated

- 20% welcome bonus of upto $10,000
- Minimum deposit $100
- Verify your account before the bonus is credited
- Fund Moneta Markets account with a minimum of $250
- Opt in using the form to claim your 50% deposit bonus
Learn to Trade
Never Miss A Trade Again

Signal Notification
Real-time signal notifications whenever a signal is opened, closes or Updated

Get Alerts
Immediate alerts to your email and mobile phone.

Entry Price Levels
Entry price level for every signal Just choose one of our Top Brokers in the list above to get all this free.