XRP/USD Long-term Trend: Bearish
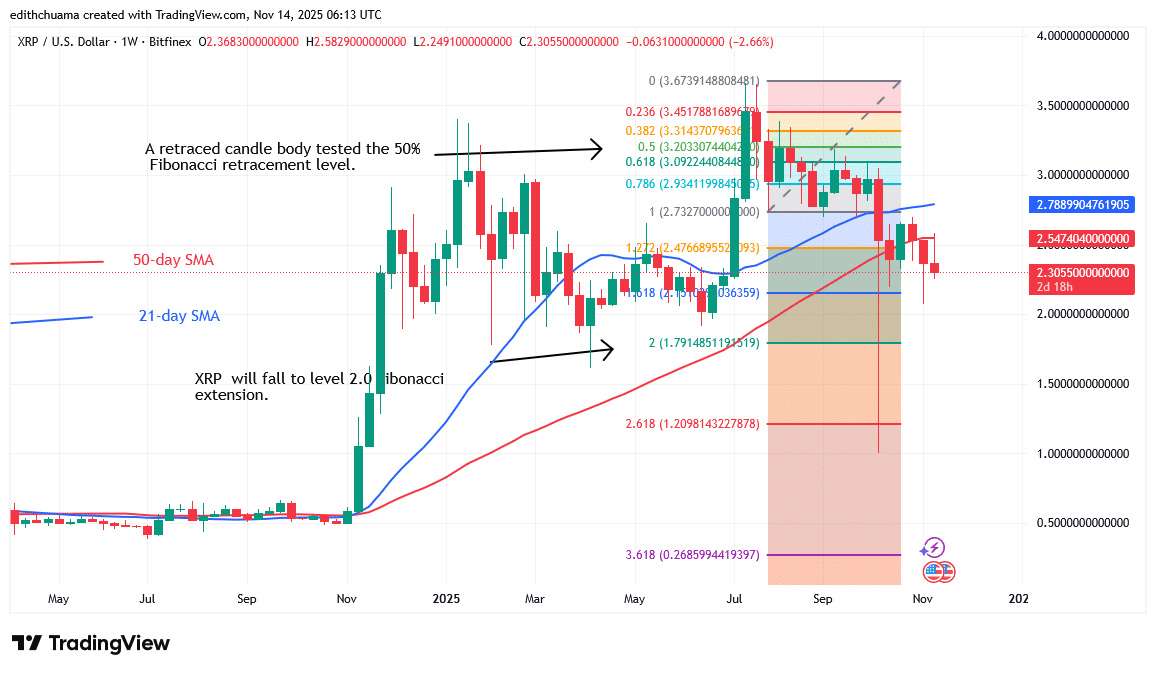
The XRP price slips back to the bearish trend zone as it confronts the $2.54 barrier. XRP has traded above the $2.20 support but below the moving averages. The weekly chart shows XRP sliding after being rejected by the 50-day SMA barrier. On the downside, if the bears break below the present support of $2.20, the altcoin will plummet to a low of $1.61. Additionally, the price signal indicates that the coin will keep declining.
On August 4, a retraced candlestick body tested the 50% level. The retracement suggests that XRP will fall to the 2.0 Fibonacci extension, or a low of $1.79. The negative momentum is predicted to hit a low of $1.20. The cryptocurrency is now valued $2.26 as of this writing.
Technical indicators
Key Resistance Levels: $2.50, $3.00, $3.50
Key Support Levels: $1.50, $1.00, $0.50
Weekly Chart Indicators Reading:
On the weekly chart, the moving average lines are sloping upward, indicating a prior rally. The price bars are below the moving average lines, suggesting a fall. The price bars’ resistance line is the 50-day simple moving average. XRP will resume its positive trend if buyers hold the price above the moving average lines.
XRP/USD Medium-term Trend: Ranging
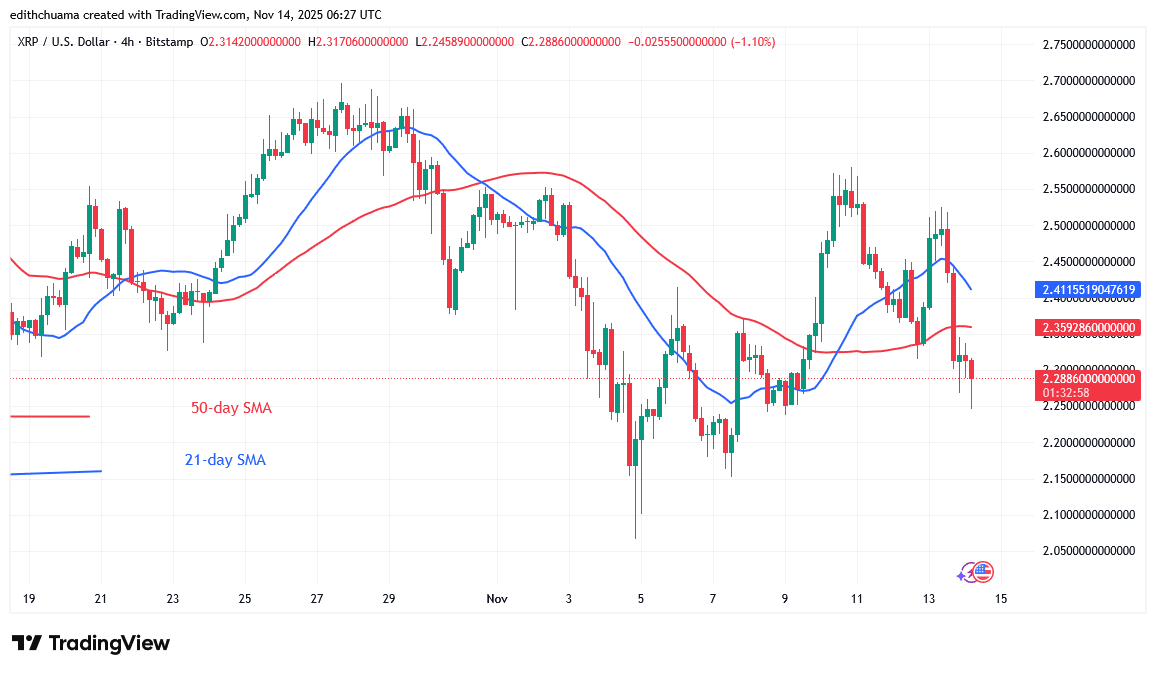
On the 4-hour chart, XRP is in a sideways trend, trading above the $2.15 support but below the $2.60 resistance. The cryptocurrency price has fluctuated both below and above the moving average lines. Today, the XRP price fell below the moving average lines as bears attempted to push it below the current support of $2.20.
4- Chart Indicators Reading
The moving average lines slope horizontally, suggesting a lateral trend. The 21-day SMA is above the 50-day SMA, indicating a decrease. The extended candlestick tails point to the $2.20 support, indicating strong buying pressure there.
General Outlook for Ripple (XRP)
XRP is sliding as it confronts the $2.54 barrier. On the 4-hour chart, the cryptocurrency is trading above the $2.15 support but below the $2.60 resistance level. On the downside, bears have repeatedly targeted the current $2.20 support level. Meanwhile, the cryptocurrency signal is unfavorable, as it trades in the bearish trend zone.
Make money without lifting your fingers: Start using a world-class auto trading solution.
Note: Learn2.Trade is not a financial advisor. Do your research before investing your funds in any financial asset, product, or event. We are not responsible for your investment results.
- Broker
- Min Deposit
- Score
- Visit Broker

- Award-winning Cryptocurrency trading platform
- $100 minimum deposit,
- FCA & Cysec regulated

- 20% welcome bonus of upto $10,000
- Minimum deposit $100
- Verify your account before the bonus is credited
- Fund Moneta Markets account with a minimum of $250
- Opt in using the form to claim your 50% deposit bonus
Learn to Trade
Never Miss A Trade Again

Signal Notification
Real-time signal notifications whenever a signal is opened, closes or Updated

Get Alerts
Immediate alerts to your email and mobile phone.

Entry Price Levels
Entry price level for every signal Just choose one of our Top Brokers in the list above to get all this free.