XRP/USD Long-term Trend: Ranging
The price of XRP breaches the crucial support level and declines below the $2.00 low. The cryptocurrency asset has been moving sideways between the $2.00 mark and the $3.00 resistance. The current price range has been breached as bears attempt to drive the digital asset lower. The price indication on the weekly chart has forecasted that the cryptocurrency will continue to fall.
A retraced candle body tested the 61.8% Fibonacci retracement level on March 10th, when prices began to decline. The retracement suggests that XRP will continue its downward trend. The $2.00 support has been broken, which is a drawback. The price indicator predicts that XRP will drop to the Fibonacci extension level of 1.618, or $1.06. Meanwhile, there is a range between the price of the cryptocurrency and the $2.00 support.

Technical indicators
Key Resistance Levels: $2.50, $3.00, $3.50
Key Support Levels: $1.50, $1.00, $0.50
Weekly Chart Indicators Reading:
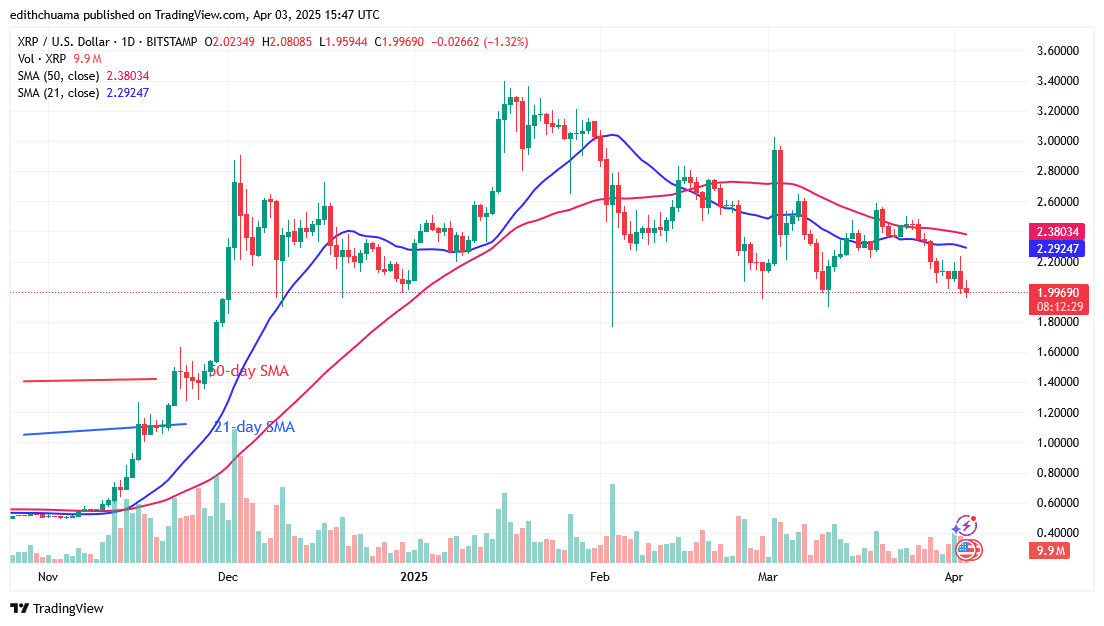
The prior rise is indicated by the upward-sloping moving average lines. XRP has been trapped between the moving average lines. The crypto price has broken below the 21-day SMA support and is still declining to the 50-day SMA.
XRP/USD Medium-term Trend: Bearish
The price of XRP is declining as it attempts to breach the $2.00 support. The current $2.00 support has been maintained since February 3. The selling pressure will continue if the existing support is broken. The level of price volatility has been limited by the usage of Doji candlesticks.
Daily Chart Indicators Reading
The sideways trend is indicated by the horizontal moving average lines. The present decrease is shown by the 21-day SMA being below the 50-day SMA. Doji candlesticks have been used to describe price fluctuation.
General Outlook for Ripple (XRP)
XRP may continue to drop after it declines below the $2.00 low. On the weekly chart, the price of XRP drops after breaking through the 21-day SMA support. The bearish momentum is approaching the 50-day SMA. Meanwhile, the cryptocurrency signal is negative as XRP declines and breaks the current price range.
Make money without lifting your fingers: Start using a world-class auto trading solution.
Note: Learn2.Trade is not a financial advisor. Do your research before investing your funds in any financial asset or presented product or event. We are not responsible for your investing results.
- Broker
- Min Deposit
- Score
- Visit Broker

- Award-winning Cryptocurrency trading platform
- $100 minimum deposit,
- FCA & Cysec regulated

- 20% welcome bonus of upto $10,000
- Minimum deposit $100
- Verify your account before the bonus is credited
- Fund Moneta Markets account with a minimum of $250
- Opt in using the form to claim your 50% deposit bonus
Learn to Trade
Never Miss A Trade Again

Signal Notification
Real-time signal notifications whenever a signal is opened, closes or Updated

Get Alerts
Immediate alerts to your email and mobile phone.

Entry Price Levels
Entry price level for every signal Just choose one of our Top Brokers in the list above to get all this free.