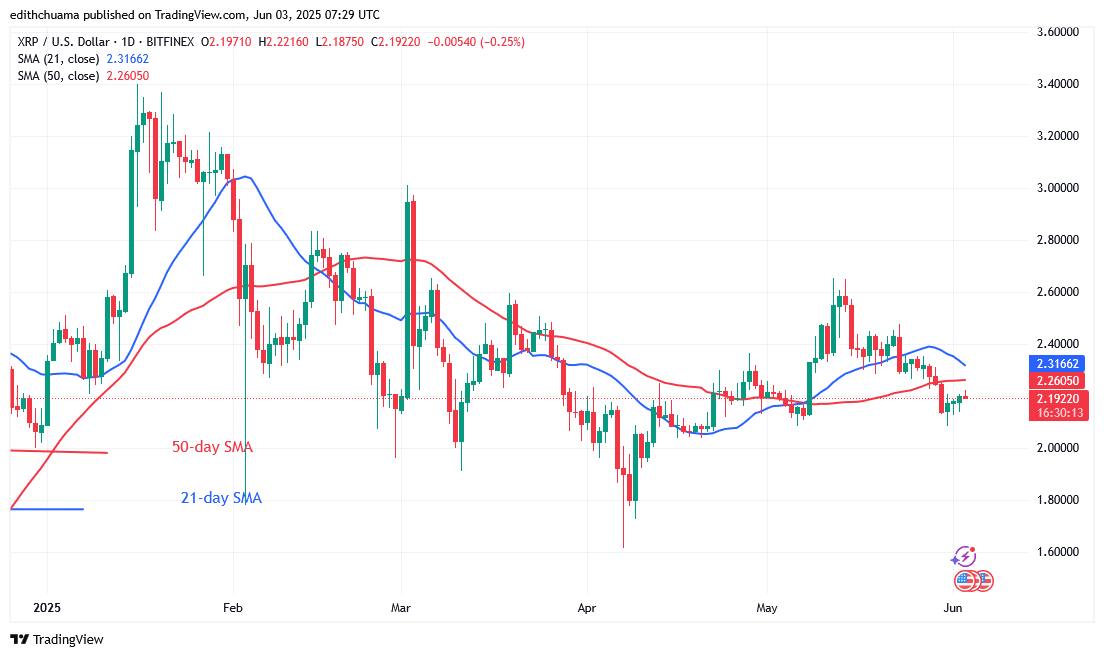
XRP/USD Long-term Trend: Bearish
XRP’s price drops to a low of $2.08 as it enters bearish exhaustion. The altcoin’s price range in the previous price action was between $2.00 and $2.65. The altcoin has fallen to a low of $2.00. XRP’s price is rising as a result of the $2.00 support. The price will restart its upward trend once it breaks above the moving average lines.
The upward trend will now reach the peak of $2.65. On the downside, as the market approaches bearish exhaustion, a break below $2.00 seems unlikely. Nevertheless, if XRP breaks through the current support, it will return to the prior low of $1.61.
Technical indicators
Key Resistance Levels: $2.50, $3.00, $3.50
Key Support Levels: $1.50, $1.00, $0.50
Daily Chart Indicators Reading:
The horizontal lines of the 50-day and 21-day moving averages are above the price bars. The altcoin hit the $2.00 support, which eased the selling pressure. The Doji candlesticks are forming a consolidation above the $2.00 crucial support. This will result in a static price movement. The altcoin is currently below the moving average lines.
XRP/USD Medium-term Trend: Bearish
The price of XRP dropped on the 4-hour chart and hovered above the $2.10 support on May 31. The altcoin is currently trading above the $2.10 support and below the moving average lines or the $2.20 barrier. The 21-day SMA support was breached, and the price of XRP is rising. The price of cryptocurrency is battling near the $2.20 mark. Once it surpasses the 50-day SMA and the $2.20 boundaries, XRP will start to move again.
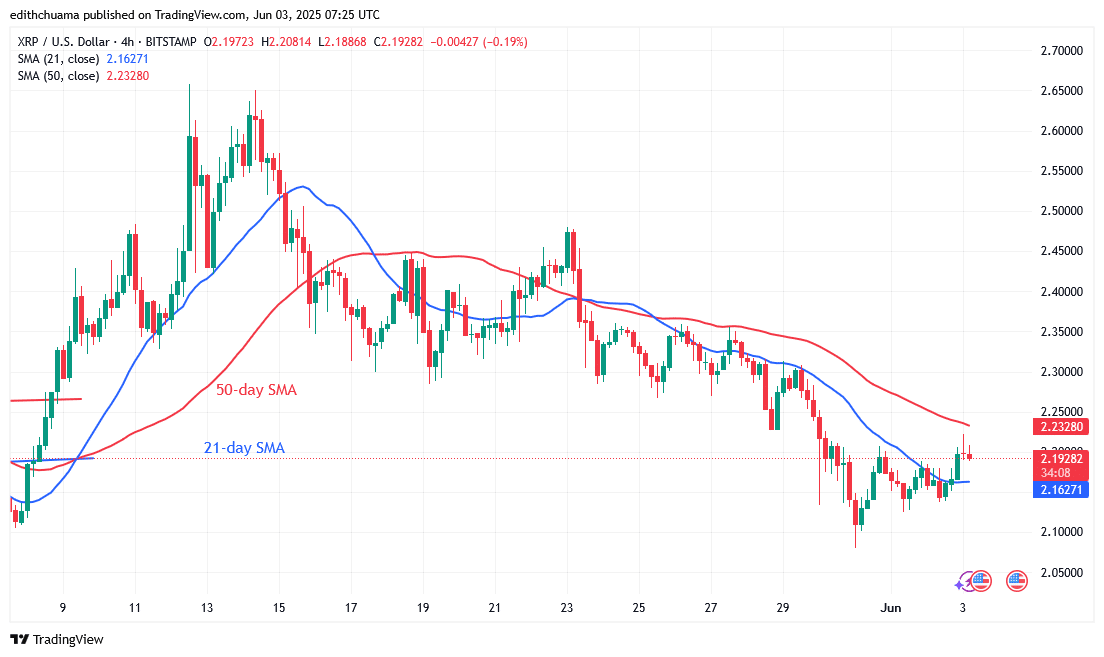
4-hour Chart Indicators Reading
The 21-day SMA is below the 50-day SMA, signaling a drop, and the moving average lines are sloping south. The price of XRP is currently fluctuating between the moving average lines after breaking above the 21-day SMA level. Since the cryptocurrency price is caught between the moving average lines, it will be compelled to move in a range.
General Outlook for Ripple (XRP)
XRP recovers above the $2.00 support as it enters bearish exhaustion. At the moment, it is trading below the resistance at $2.20 and above the $2.10 support. The $2.20 barrier is currently halting the rising trend. In preparation for a bullish trend, the altcoin has been bouncing below the $2.20 resistance since May 31. At the same time, the price of XRP is moving sideways above the $2.00 support.
Make money without lifting your fingers: Start using a world-class auto trading solution.
Note: Learn2.Trade is not a financial advisor. Do your research before investing your funds in any financial asset, product, or event. We are not responsible for your investment results.
- Broker
- Min Deposit
- Score
- Visit Broker

- Award-winning Cryptocurrency trading platform
- $100 minimum deposit,
- FCA & Cysec regulated

- 20% welcome bonus of upto $10,000
- Minimum deposit $100
- Verify your account before the bonus is credited
- Fund Moneta Markets account with a minimum of $250
- Opt in using the form to claim your 50% deposit bonus
Learn to Trade
Never Miss A Trade Again

Signal Notification
Real-time signal notifications whenever a signal is opened, closes or Updated

Get Alerts
Immediate alerts to your email and mobile phone.

Entry Price Levels
Entry price level for every signal Just choose one of our Top Brokers in the list above to get all this free.