STELLAR Price Analysis – May 12
Should the bears defend the resistance level of $0.75, bearish movement may commence towards the $0.67, $0.57 and $0.50.
Key Levels:
Resistance levels: $0.75, $0.84, $0.95
Support levels: $0.67, $0.57, $0.50
XLM/USD Long-term Trend: Bullish
Stellar is bullish on the daily chart. The coin moved in the direction it was predicted last week. The crypto obeyed the command of the bulls by increasing to break up the former resistance level of $0.57, the bulls’ momentum extends to $0.67 and the resistance level of $0.75 is tested. The price is currently pulling back to retest the support level of $0.67.
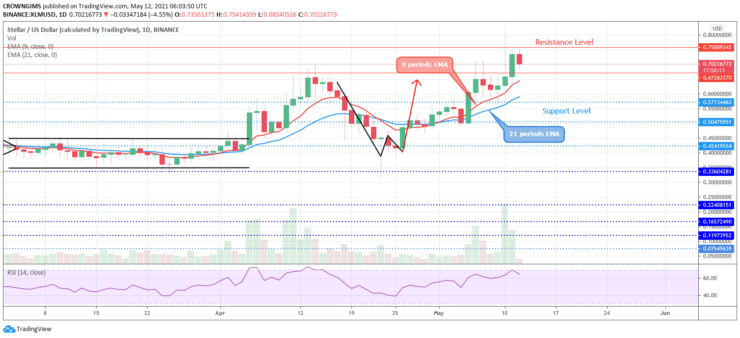
Stellar price is trading above the 9 periods EMA and 21 periods EMA which establish a bullish trend. The bulls maintain their momentum and the price has reached the high of $0.75, in case the mentioned level is penetrated, $0.84 and $0.95 levels may be tested. Should the bears defend the resistance level of $0.75, bearish movement may commence towards the $0.67, $0.57 and $0.50. The relative strength index period 14 is bending down at 60 levels to indicate sell signal.
XLM/USD Medium-term Trend: Bullish
XLM is on the bullish movement in the 4-hour chart. Stellar is increasing as the bulls hold tight to the XLM market. The price touched the resistance level of $0.75 on May 10, it pulled back and retested the $0.75 level second time on May 12. There is tendency that it may fall soon.
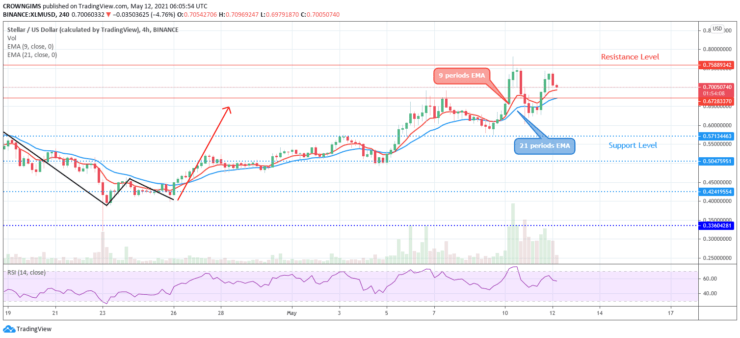
The price is trying to cross the 9 periods EMA and the 21 periods EMA downside with the price trading above the two EMAs at close range. The Relative Strength Index period 14 is at 60 levels bending down to indicate sell signal.
You can purchase crypto coins here: Buy coins
- Broker
- Min Deposit
- Score
- Visit Broker

- Award-winning Cryptocurrency trading platform
- $100 minimum deposit,
- FCA & Cysec regulated

- 20% welcome bonus of upto $10,000
- Minimum deposit $100
- Verify your account before the bonus is credited
- Fund Moneta Markets account with a minimum of $250
- Opt in using the form to claim your 50% deposit bonus
Learn to Trade
Never Miss A Trade Again

Signal Notification
Real-time signal notifications whenever a signal is opened, closes or Updated

Get Alerts
Immediate alerts to your email and mobile phone.

Entry Price Levels
Entry price level for every signal Just choose one of our Top Brokers in the list above to get all this free.