STELLAR Price Analysis – June 30
An increase of the bears’ momentum may break down the support level of $0.22, which may leads to further price decrease to the $0.16, later it may extend to $0.11 level. In case the bears’ pressure unable to break down the support level of $0.22, bulls may continue to dominate the Stellar market and the price may increase towards the $0.30, $0.42 and $0.50 resistance levels.
Key Levels:
Resistance levels: $0.30, $0.42, $0.50
Support levels: $0.22, $0.16, $0.11
XLM/USD Long-term Trend: Ranging
On the daily chart, Stellar is on the ranging movement. The support level of $0.22 is reached by the bears’ momentum. The sellers’ pressure is becoming weak and the mentioned level could not be penetrated downside. The bulls were trying to increase their momentum, so as to push the coin towards north side but the confluence at $0.30 prevents the increase. The price is currently consolidating within $0.30 and $0.22 levels.
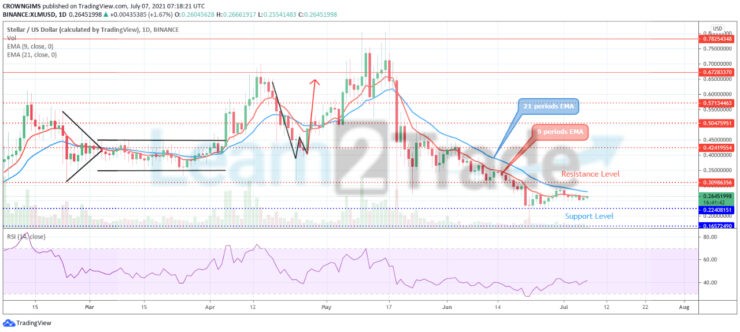
Stellar is trading between the 9 periods EMA and 21 periods EMA with the two EMAs parallel to each other, it indicate a low momentum and low volatility market. An increase of the bears’ momentum may break down the support level of $0.22, which may leads to further price decrease to the $0.16, later it may extend to $0.11 level. In case the bears’ pressure unable to break down the support level of $0.22, bulls may continue to dominate the stellar market and the price may increase towards the $0.30, $0.42 and $0.50 resistance levels. However, the relative strength index period 14 is bending up at 40 levels to indicate buy signal.
XLM/USD Medium-term Trend: Ranging
XLM is on the ranging movement in the 4-hour chart. Further price reduction was opposed at the support level of $0.22 on June 22. The bulls’ momentum is weak and could not push up the price. The price start to consolidate within the $0.30 and $0.22 price levels.
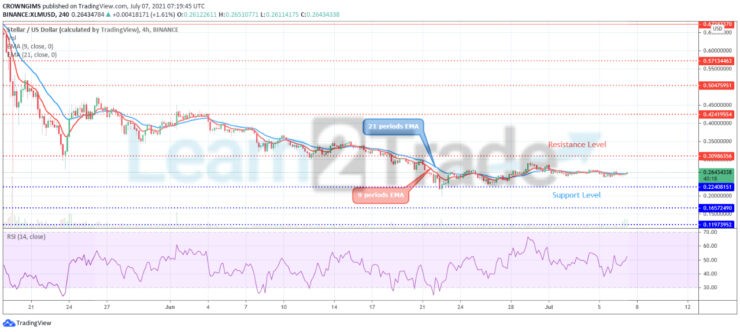
The price is hovering over the 9 periods EMA and the 21 periods EMA as a sign of ranging movement. However, the Relative Strength Index period 14 is at 50 levels pointing up to indicate buy signal.
You can purchase crypto coins here. Buy Tokens
- Broker
- Min Deposit
- Score
- Visit Broker

- Award-winning Cryptocurrency trading platform
- $100 minimum deposit,
- FCA & Cysec regulated

- 20% welcome bonus of upto $10,000
- Minimum deposit $100
- Verify your account before the bonus is credited
- Fund Moneta Markets account with a minimum of $250
- Opt in using the form to claim your 50% deposit bonus
Learn to Trade
Never Miss A Trade Again

Signal Notification
Real-time signal notifications whenever a signal is opened, closes or Updated

Get Alerts
Immediate alerts to your email and mobile phone.

Entry Price Levels
Entry price level for every signal Just choose one of our Top Brokers in the list above to get all this free.