When there is a breakdown of the support level at $0.14, bearish momentum may drive the price towards $0.10, and $0.007. On the other hand, the bulls may defend the support level at $0.14, this will increase the price to $0.18, $0.25 and $0.30 levels.
XLM/USD Market
Key Levels:
Resistance levels: $0.18, $0.25, $0.30
Support levels: $0.14, $0.10, &0.07
XLM/USD Long-term Trend: Bearish
Stellar continues on the bearish movement. The coin was on the ranging movement last week when the bulls lost momentum to break up the resistance level of $0.25. Also, the bears opposed the bullish movement and the daily candle turned to inverted pin bar. Sellers gained more pressure to push down the price and it decline towards the support level of $0.18. It broke the just mentioned level downside, currently targeting $0.14 level.
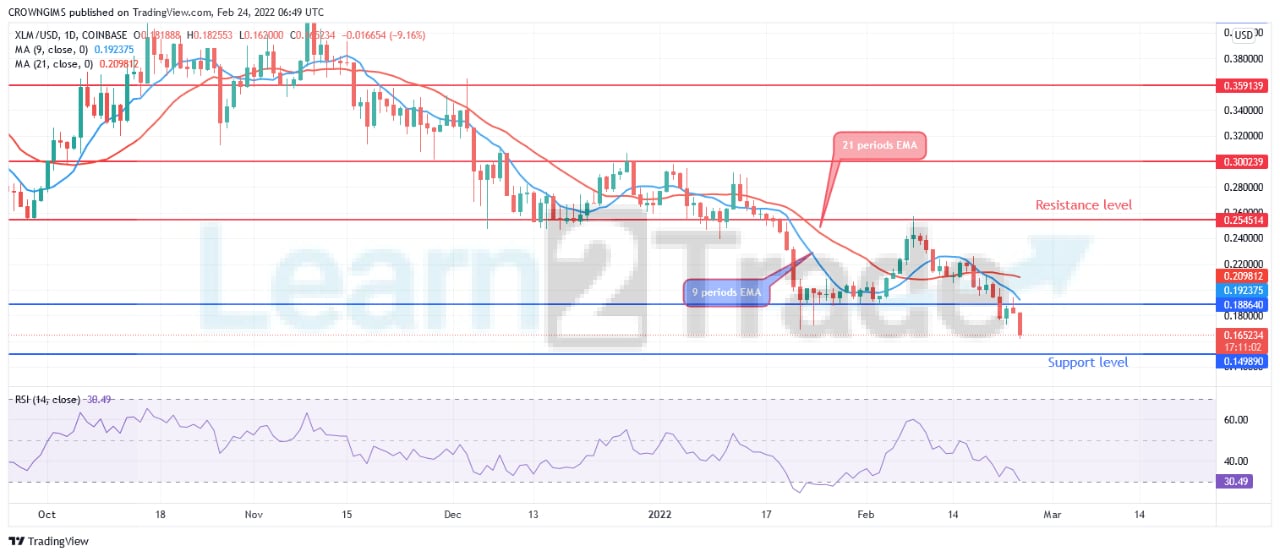
The two dynamic support levels is broken downside and the price is trading below the 9 periods EMA and 21 periods EMA which indicate that sellers are dominating stellar market. Bears are exerting more pressure and further price decrease envisaged. When there is a breakdown of the support level at $0.14, bearish momentum may drive the price towards $0.10, and $0.007. On the other hand, the bulls may defend the support level at $0.14, this will increase the price to $0.18, $0.25 and $0.30 levels. However, the relative strength index period 14 is pointing down at 31 levels which connotes sell signal.
XLM/USD Medium-term Trend: Bearish
XLM is bearish on the 4-hour chart. The sellers’ pressure increased last week and the price decreased accordingly from the resistance level of $0.25 to the support level of $0.18. The price pulled back to retest the dynamic resistance level. More pressure from the sellers pushed down the price towards the support level of $0.14 level.
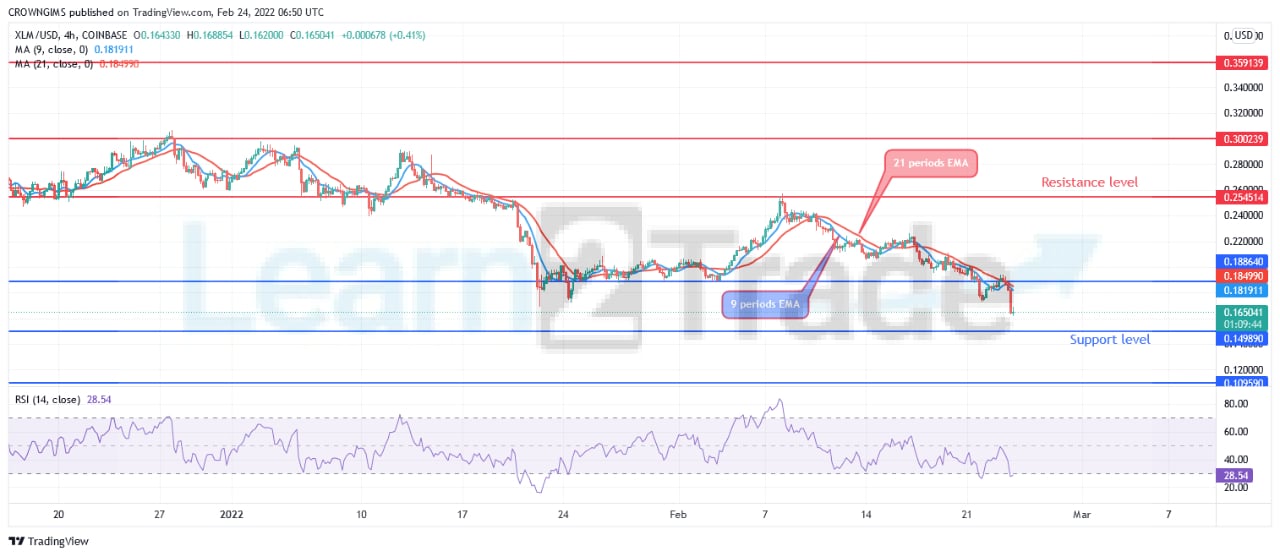
The price is trading below the 9 periods EMA and 21 periods EMA with the 9 periods EMA crossing the 21 periods EMA downside. The Relative Strength Index period 14 is at 31 levels and the signal line is displaying bearish direction.
- Broker
- Min Deposit
- Score
- Visit Broker

- Award-winning Cryptocurrency trading platform
- $100 minimum deposit,
- FCA & Cysec regulated

- 20% welcome bonus of upto $10,000
- Minimum deposit $100
- Verify your account before the bonus is credited
- Fund Moneta Markets account with a minimum of $250
- Opt in using the form to claim your 50% deposit bonus
Learn to Trade
Never Miss A Trade Again

Signal Notification
Real-time signal notifications whenever a signal is opened, closes or Updated

Get Alerts
Immediate alerts to your email and mobile phone.

Entry Price Levels
Entry price level for every signal Just choose one of our Top Brokers in the list above to get all this free.