STELLAR Price Analysis – January 26
When the price break down the support level of $0.16, by the bears’ increased momentum, the price may decrease to the low of $0.11, which may extend to $0.07 level. In case the bears’ pressure are unable to break down the support level of $0.16, bulls may take over and the price may increase towards the $0.20, $0.24 and $0.30 resistance levels.
Key Levels:
Resistance levels: $0.20, $0.24, $0.30
Support levels: $0.16, $0.11, $0.07
XLM/USD Long-term Trend: Bearish
On the daily chart, Stellar is bearish. The coin has been obeying the command of sellers for more than three weeks. The support level of $0.24 has been tested and slightly pullback. At the moment, it seems the sellers’ momentum is getting weak as the price is consolidating and pulling back with formation of hammers at the $0.16 zone, closer to the dynamic resistance levels.
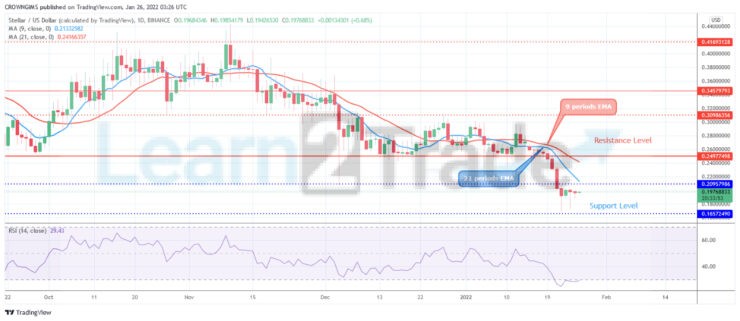
Stellar price is trading below the 9 periods EMA and 21 periods EMA which indicate a bearish momentum. When the price break down the support level of $0.16, by the bears’ increased momentum, the price may decrease to the low of $0.11, which may extend to $0.07 level. In case the bears’ pressure are unable to break down the support level of $0.16, bulls may take over and the price may increase towards the $0.20, $0.24 and $0.30 resistance levels. The relative strength index period 14 is bending up at 20 levels to indicate buy signal.
XLM/USD Medium-term Trend: Ranging
XLM is on the ranging movement in the 4-hour chart. The bears’ momentum and that of the bulls seems to be equal and this is what is causing consolidation in the Stellar market. However, the price action seems to bring out a head and shoulder chart pattern which may be a bullish signal.
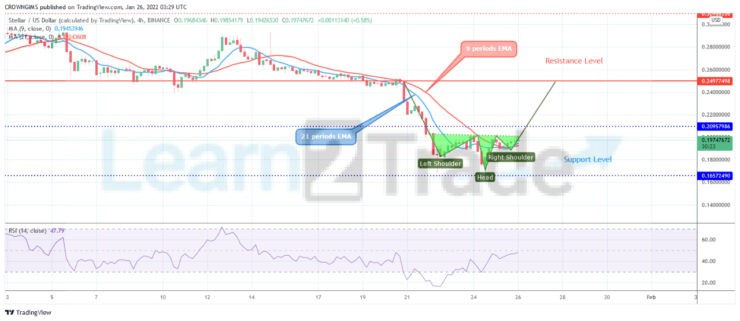
The price is crossing over the 9 periods EMA and the 21 periods EMA as a sign of bullish movement. The Relative Strength Index period 14 is at 50 levels pointing up to indicate buy signal.
You can purchase crypto coins here: Buy coins
- Broker
- Min Deposit
- Score
- Visit Broker

- Award-winning Cryptocurrency trading platform
- $100 minimum deposit,
- FCA & Cysec regulated

- 20% welcome bonus of upto $10,000
- Minimum deposit $100
- Verify your account before the bonus is credited
- Fund Moneta Markets account with a minimum of $250
- Opt in using the form to claim your 50% deposit bonus
Learn to Trade
Never Miss A Trade Again

Signal Notification
Real-time signal notifications whenever a signal is opened, closes or Updated

Get Alerts
Immediate alerts to your email and mobile phone.

Entry Price Levels
Entry price level for every signal Just choose one of our Top Brokers in the list above to get all this free.