Key Resistance Levels: $66.00, $70.00, $74.00
Key Support Levels: $48.00,$44.00,$40.00
USOIL (WTI) Long-term Trend: Bullish
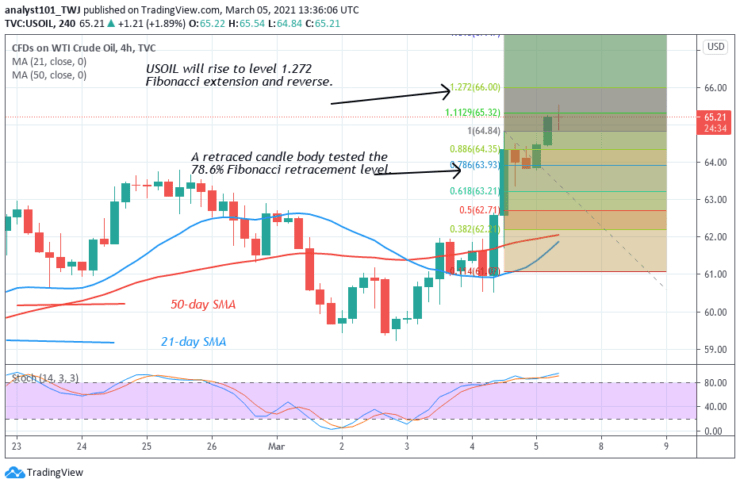
USOIL is in a smooth uptrend. The crude oil has risen a high of $64 and was resisted. The price retraced to $60 and resumed the upward move. The resistance at $64 was broken as the market continues its upside momentum. USOIL is likely to reach the high of $68 but the price is likely to reach the overbought region.

Daily Chart Indicators Reading:
USOIL (WTI) is at level 68 of Relative Strength Index period 14. It indicates that price is approaching the overbought region. The 21-day and 50-day SMAs are sloping northward indicating the uptrend.
USOIL (WTI) Medium-term bias: Bullish
On the 4 hour chart, the USOIL is in an upward move but the price has reached the overbought region of the market. On March 4 uptrend; a retraced candle body tested the 78.6% Fibonacci retracement level. The retracement indicates that the market will rise to level 1.272 Fibonacci extension. That is the high of level $66.00. The USOIL is expected to reverse at that price level.