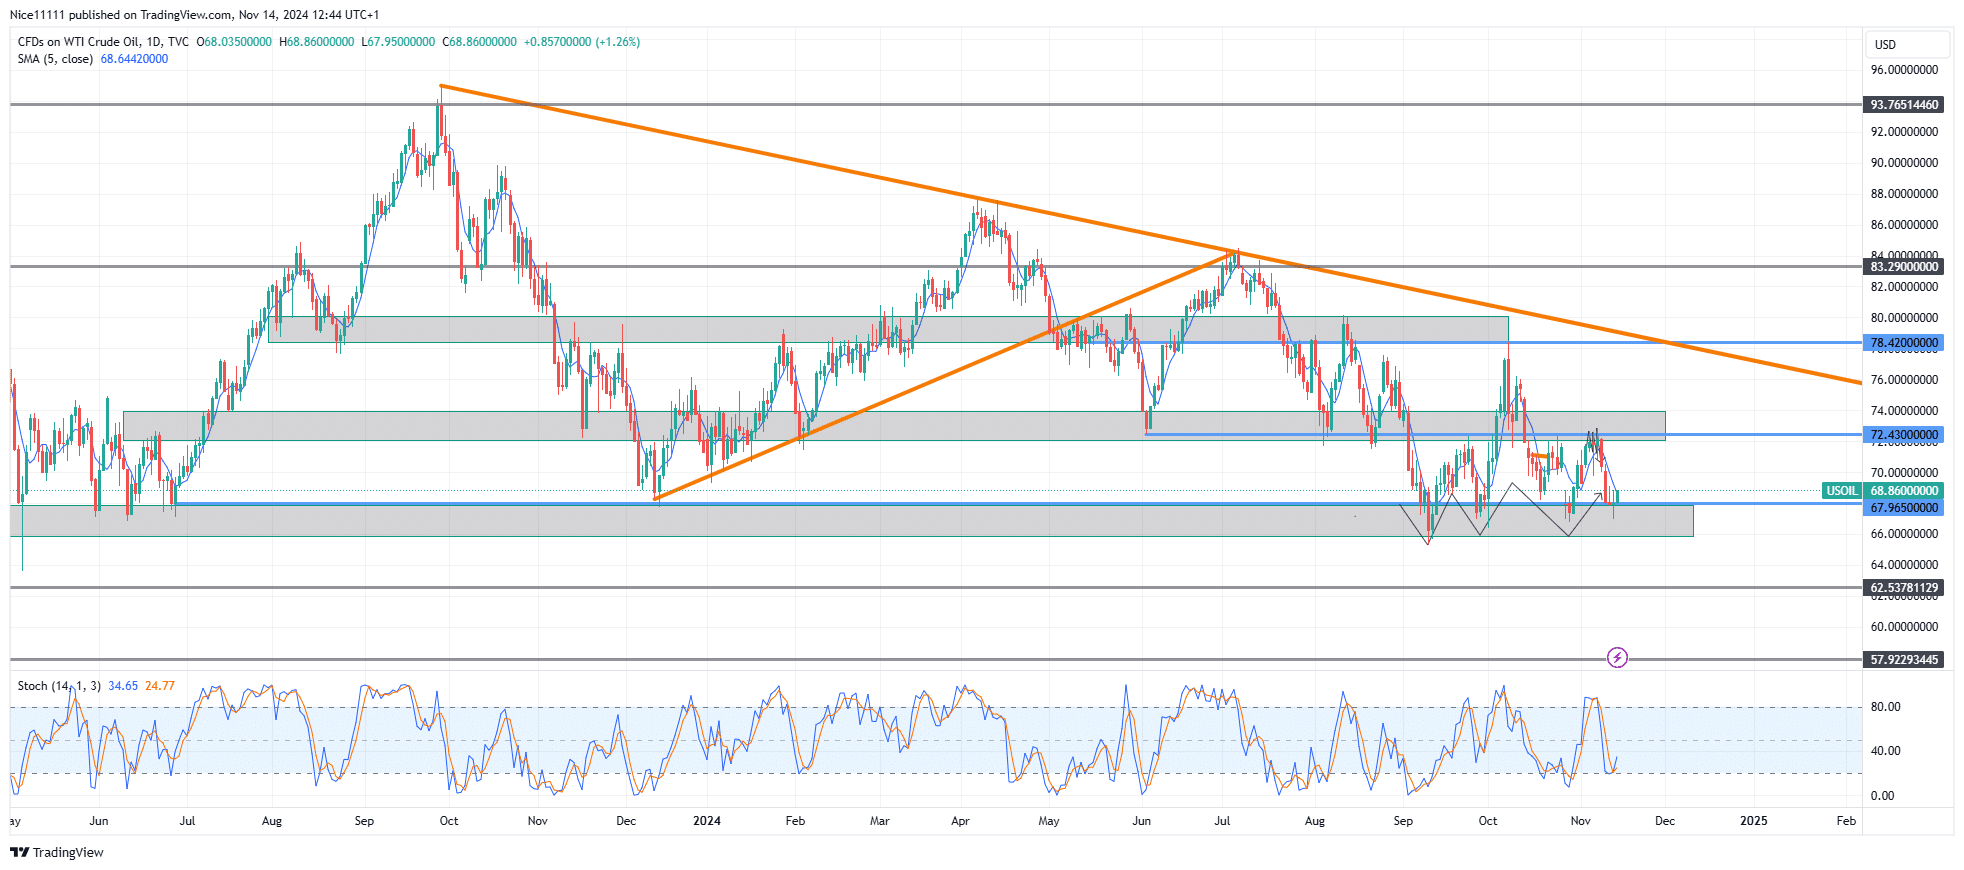
USOil has been range-bound between two crucial price levels since September. The market has repeatedly failed to break through resistance at 72.430, while the 67.970 support has consistently held firm. Currently, the price is resting at this support zone, showing clear signs of a potential reversal.
The 67.970 support zone has demonstrated remarkable resilience, consistently serving as a reliable foundation since last year. It has withstood five tests this year alone, reinforcing its significance as a critical demand level for traders.
A head-and-shoulders pattern has also emerged, a formation that often signals either a bearish breakout or a reversal. In this case, the “shoulders” align with the 72.430 resistance zone, intensifying the pressure on the 67.970 support level. Additionally, the Stochastic indicator is showing oversold conditions, suggesting that a potential reversal could be imminent if buyers manage to sustain their strength.
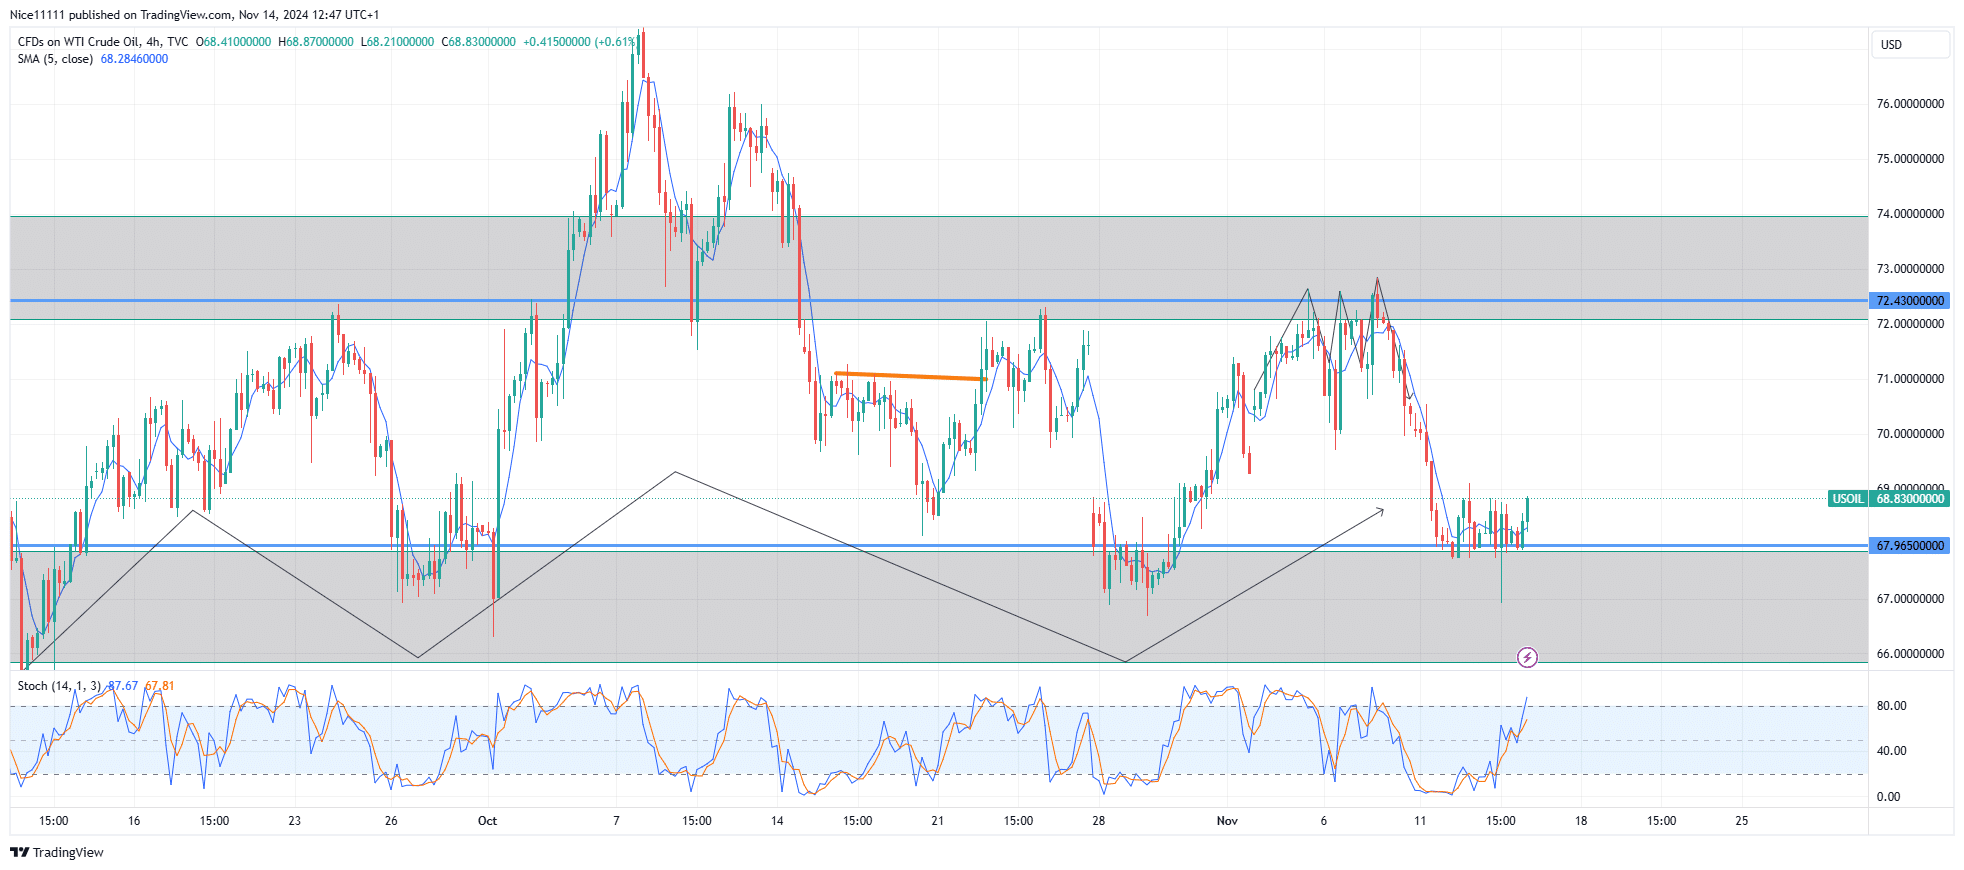
USOil Short-term Trend: Ranging
On lower timeframes, rejection candles indicate strong buying interest at the 67.970 support level. The price is now starting to move upward from this zone, with the 9-period Moving Average positioned below recent candlesticks to reinforce the upward movement. Traders looking to capitalize on this setup may benefit from incorporating insights from forex signals to refine their strategy and navigate potential market shifts.
Note: Learn2.trade is not a financial advisor. Do your research before investing your funds in any financial asset, product, or event. We are not responsible for your investment results.
Trade on MT4 with Leverage up to 1:500! Trade on MT4 with Leverage up to 1:500!
X
We use cookies to ensure that we give you the best experience on our website. If you continue to use this site we will assume that you are happy with it.