

Market Analysis – May 9
USOil rejects resistance and confirms downward momentum below key levels. The 9-day Simple Moving Average (SMA) at $59.10 is currently positioned just below the daily close of $60.00, serving as dynamic resistance. The Stochastic Oscillator shows a slight uptick, with %K at 48.93 and %D at 37.81, suggesting the possibility of a short-term bounce. However, this movement is occurring within a broader bearish trend, and the absence of a crossover near overbought levels implies that any rally may be limited or short-lived.
USOil Key Levels
Resistance Levels: $61.80, $65.30, $72.00
Support Levels: $55.20, $52.00, $50.10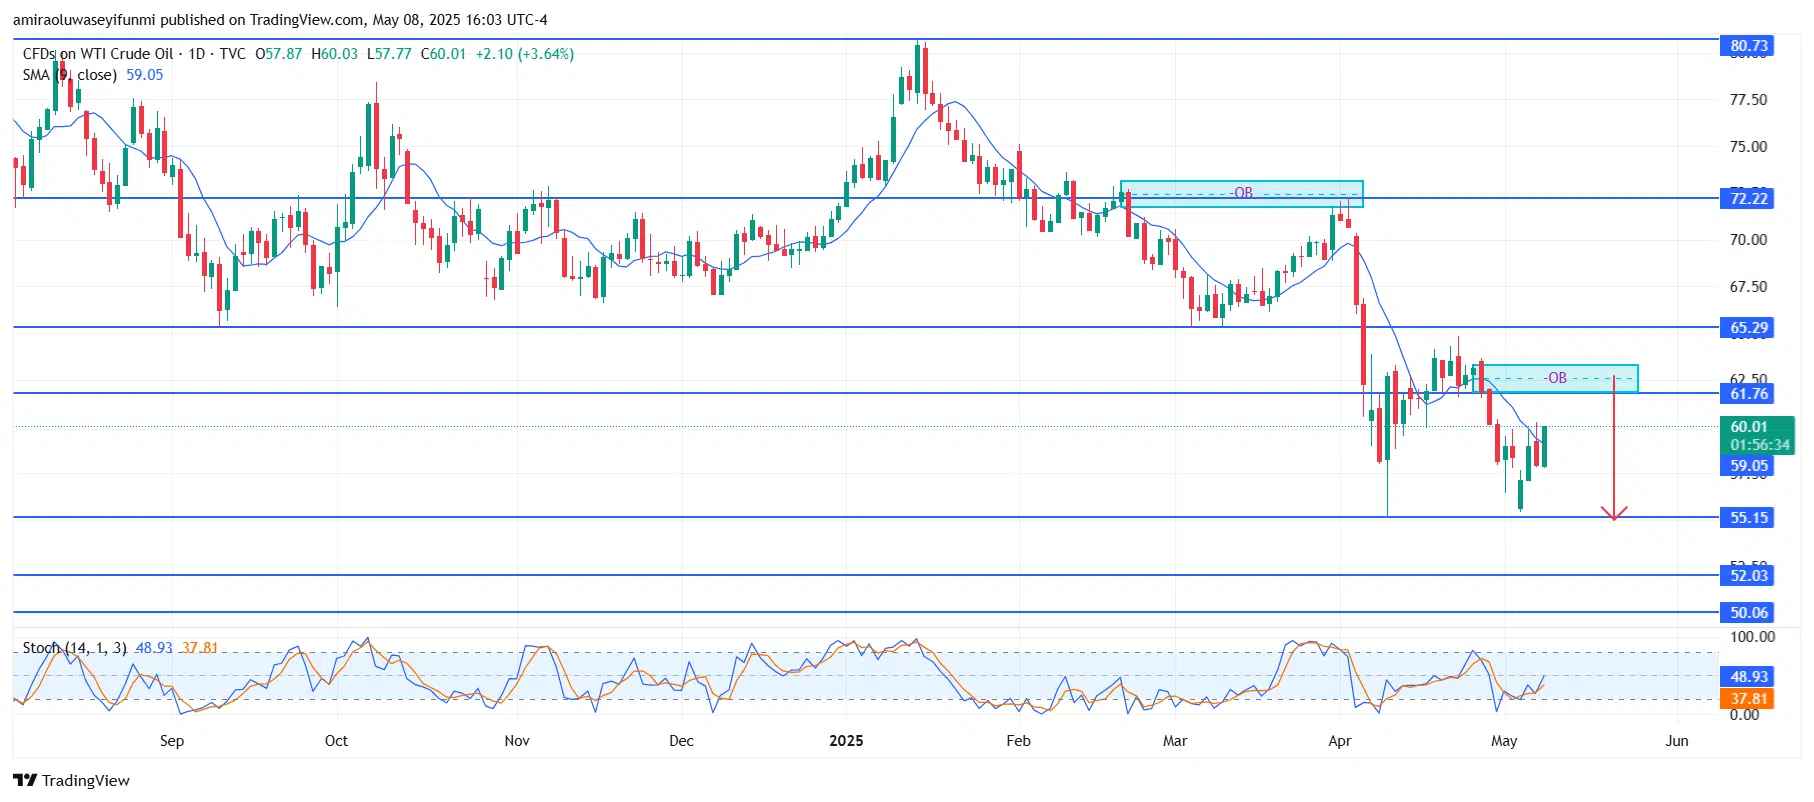
USOil Long-Term Trend: Bearish
The price action reveals a clear rejection from the $61.80 supply zone and order block (OB), which previously served as support and now acts as resistance. The bearish engulfing candle that followed the test of this level reinforces the bearish sentiment. The market structure has shifted to a series of lower highs and lower lows since the breakdown from $72.20, confirming sustained seller control. The inability to maintain levels above $60.00 further highlights bearish dominance.
The outlook for USOIL remains bearish as long as price stays below the $61.80 resistance. Continued selling pressure is likely to drive price toward the next significant support at $55.20. A break below $55.20 could lead to deeper declines targeting $52.00 or even $50.10. Unless price reclaims and holds above $61.80, any upward attempts are expected to encounter strong resistance and renewed selling interest. Traders may look to forex signals for additional confirmation during key market turns.
USOil Short-Term Trend: Bearish
Make money without lifting your fingers: Start using a world-class auto trading solution
How To Buy Lucky Block
Note: Learn2.trade is not a financial advisor. Do your research before investing your funds in any financial asset, product, or event. We are not responsible for your investment results.


