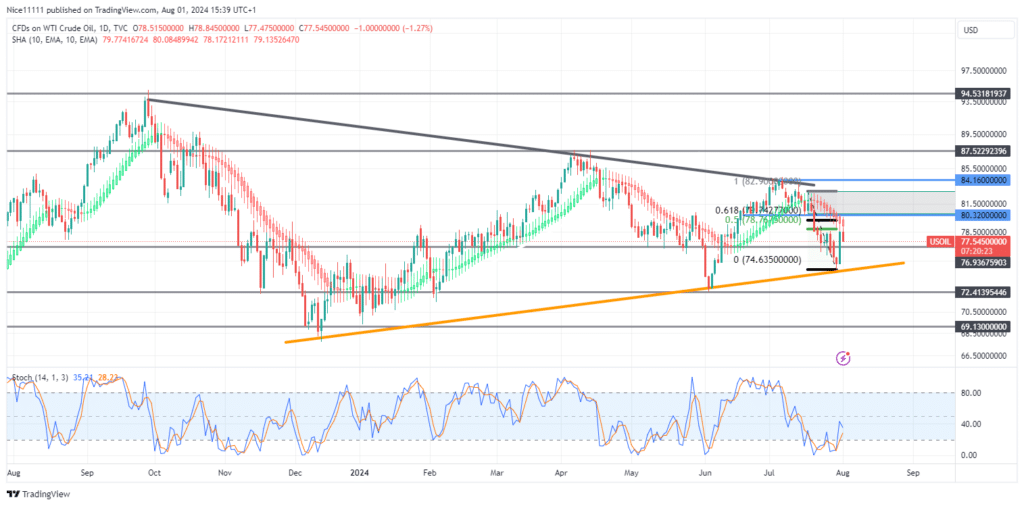
USOil price surged by 4.53% on July 31. This significant single-day rise occurred within a broader bearish trend, driven by the price hitting a bullish supporting trend line as the Stochastic indicator signaled the market was oversold.
USOil price action has led to the formation of a symmetrical triangle characterized by lower highs and higher lows on the daily chart. The range of each new trend formed after retesting the borders of the pattern is narrowing as the triangle converges to a point.
The recent price decline before testing the bullish trendline in the oversold region featured a fair value gap and a bearish order block. The price is expected to retrace from the oversold region to the bearish order block at 80.30.
USOil Short-Term Trend: Bullish
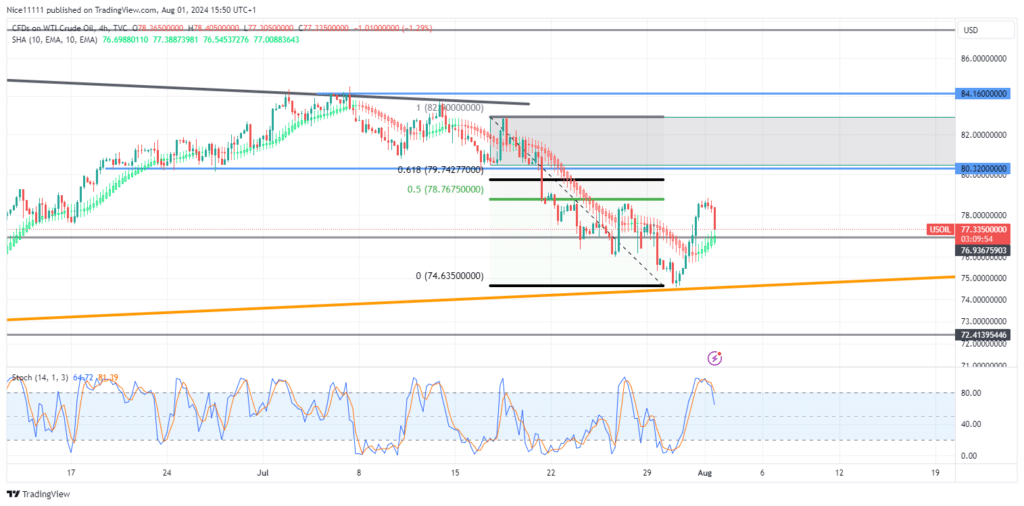
On the lower time frame, a bullish shift in market structure has been observed upon the bounce from the supporting border of the symmetrical triangle. The price pushed above the bearish order blocks which led to the bullish trendline. The Smoothed Heikin Ashi Candles have turned green, indicating a sudden upthrust in the price.
It is important to watch for the price to rise into the premium zone of the bearish displacement to capitalize on the anticipated bearish swing. The previous demand zone of 80.30, which has been broken, is expected to act as resistance, providing an opportunity for shorting. Utilizing forex signals can enhance trading decisions during these movements.
Note: Learn2.trade is not a financial advisor. Do your research before investing your funds in any financial asset, product, or event. We are not responsible for your investment results.
Trade on MT4 with Leverage up to 1:500! Trade on MT4 with Leverage up to 1:500!
X
We use cookies to ensure that we give you the best experience on our website. If you continue to use this site we will assume that you are happy with it.