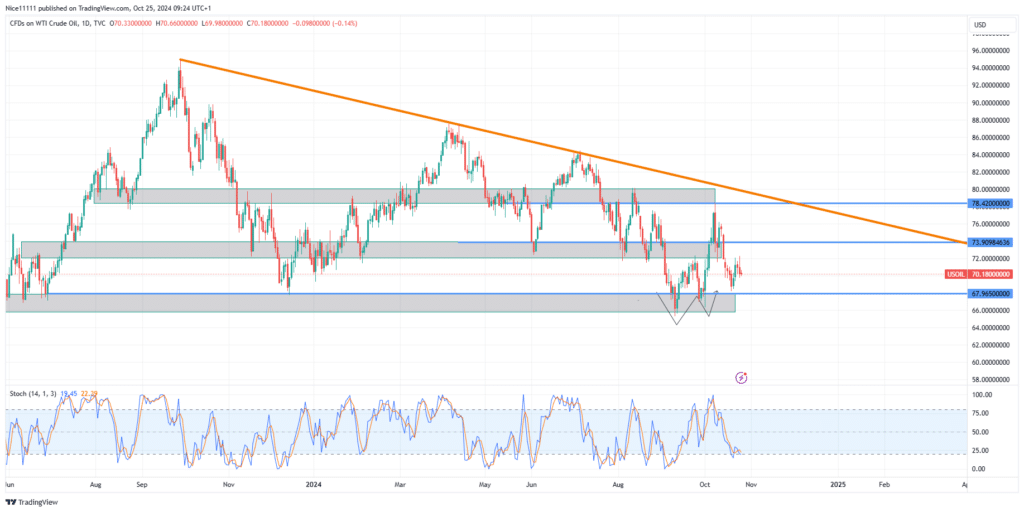
The USOil market continues to create lower highs, coupled with an equal low around the demand zone at 67.970, shaping a descending triangle on the 24-hour chart. The recent bearish move from the supply zone at 78.420 halted as it tested a bullish order block emerging near the 67.970 demand level.
The demand level at 67.970 has historically been a strong defense against bearish momentum. Despite repeated tests since last year, this zone has consistently held firm. The resilience of this level indicates strong USOil buyer interest at this zone.
After the formation of a double bottom around 67.970, WTI experienced a notable price surge, propelling the market to the supply zone at 78.420. This level presented significant resistance, where selling pressure intensified. At the supply zone, the Stochastic indicator indicated overbought conditions, pushing prices back toward the 67.970 demand zone.
USOil Short-Term Trend: Bearish
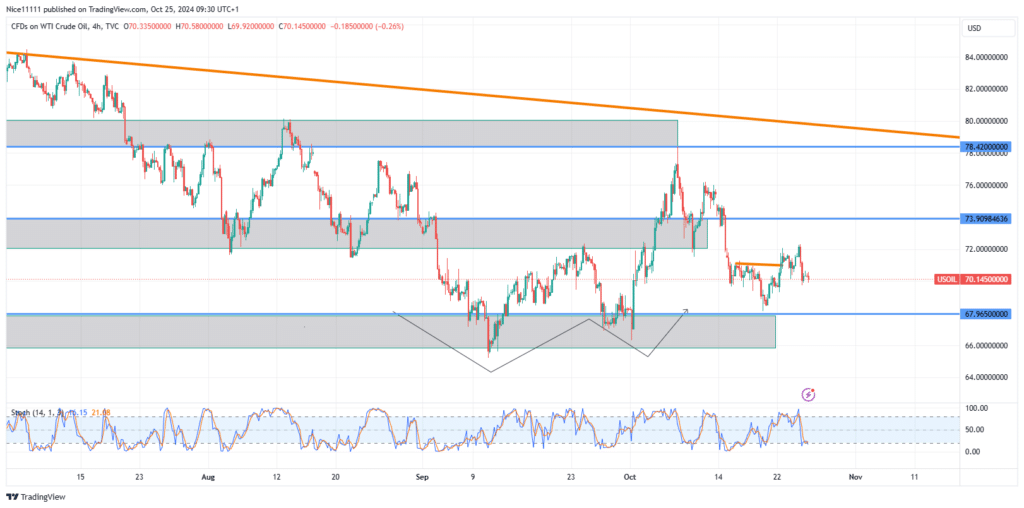
The downward movement from the 78.420 supply zone is currently cushioned by bullish order blocks rooted in the demand zone. This has sparked a change of character (ChoCh) on lower time frames, though the price hasn’t yet reached the 67.970 demand level. The Stochastic indicator signals an oversold condition on both the higher and lower timeframe. A potential short-term bullish retracement towards the bearish trendline on the daily chart is therefore plausible and will be considered in forex signals.
Note: Learn2.trade is not a financial advisor. Do your research before investing your funds in any financial asset, product, or event. We are not responsible for your investment results.
Trade on MT4 with Leverage up to 1:500! Trade on MT4 with Leverage up to 1:500!
X
We use cookies to ensure that we give you the best experience on our website. If you continue to use this site we will assume that you are happy with it.