Market Analysis – March 14
USOil may experience heightened bearish momentum in the coming days. Current chart indicators suggest a continuation of this trend, with the 9-day Simple Moving Average (SMA) showing a downward trajectory around $66.820, reflecting significant selling pressure. The Relative Strength Index (RSI) stands at approximately 41.11, below the neutral 50 mark, signaling weak bullish activity and suggesting the market is nearing oversold conditions. Additionally, the RSI moving average at 38.04 reinforces the bearish sentiment by remaining below the 40 level, indicating limited buying strength.
USOil Key Levels
Resistance Levels: $77.260, $80.730, $84.490
Support Levels: $67.070, $65.290, $61.760
USOil Long-Term Trend: Bearish
The price movements indicate a persistent series of lower highs and lower lows, a hallmark of a bearish market structure. The presence of a descending trendline from the $75.140 resistance level further confirms this downward momentum. Recently, the price tested the support level around $67.070 but failed to break above the trendline, indicating that sellers remain dominant. Key horizontal support levels are identified at $67.070 and $65.290, while resistance is noted at $77.260 and the more robust $80.730 level. The market’s inability to sustain a breakout above these resistance points suggests the potential for further declines.
Given the current market conditions, USOil is likely to sustain a bearish trend unless a significant reversal breaches the descending trendline. A short-term rebound toward the $65.290 level is possible, but it may face resistance at the trendline, reinforcing the downward trend. A breach below the $65.290 support threshold could lead to a target of $61.760, aligning with historical support levels. The bearish outlook remains intact unless buyers push prices above the descending trendline, negating the current trend.
USOil Short-Term Trend: Bullish
In contrast, USOil exhibits signs of bullish momentum in the short term, maintaining price levels above the ascending trendline. The 9-day Simple Moving Average (SMA) at $66.940 supports upward movement as the price remains above this critical average.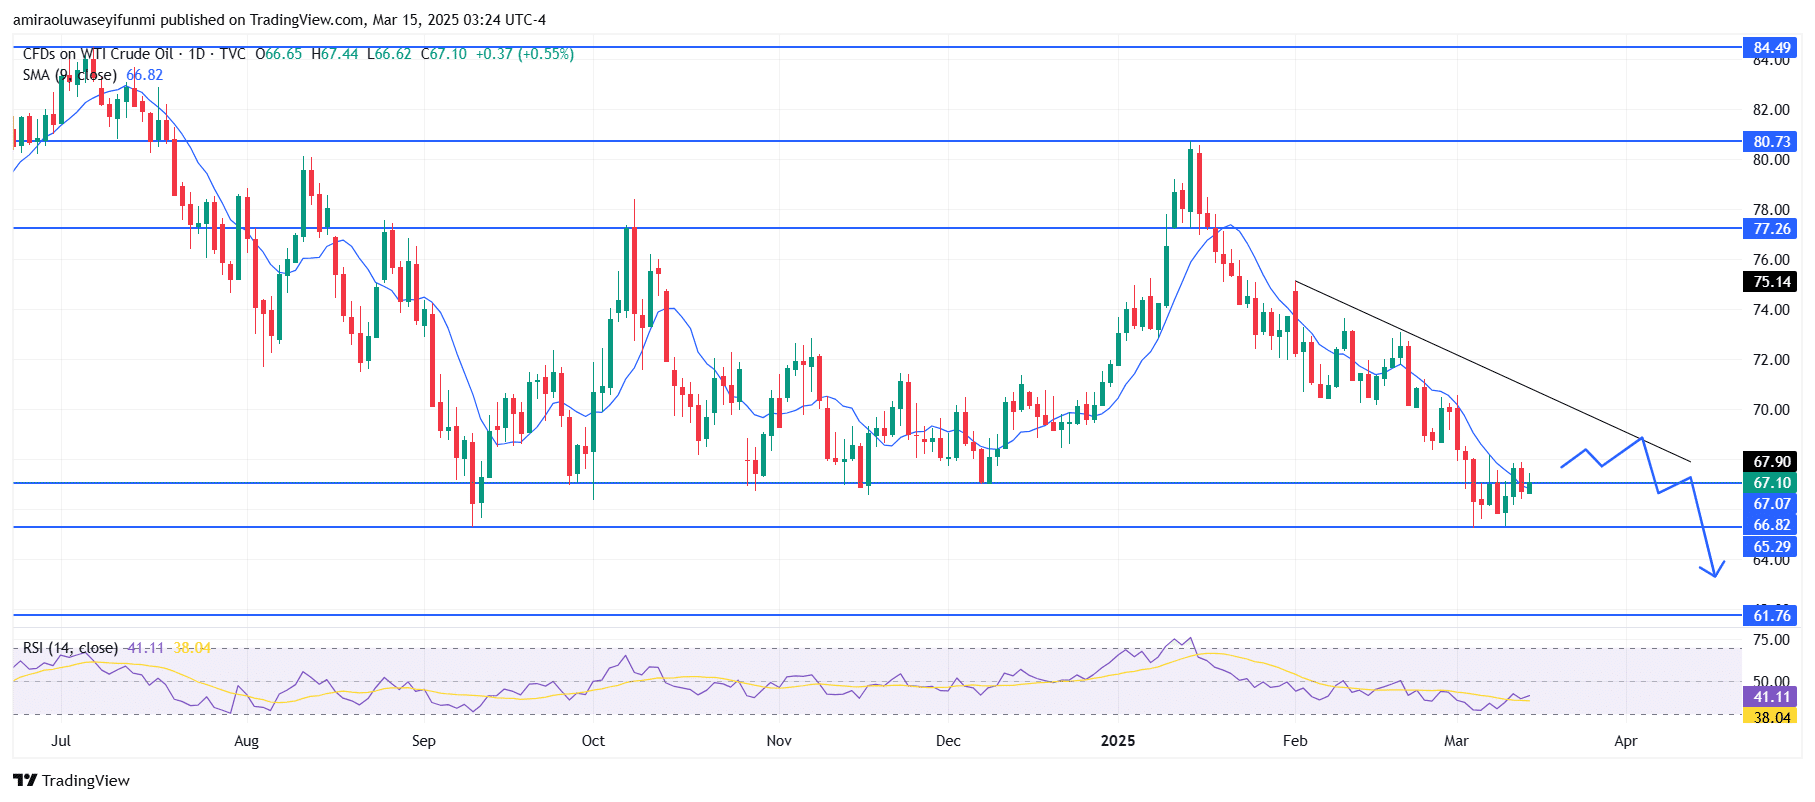
Make money without lifting your fingers: Start using a world-class auto trading solution
How To Buy Lucky Block – Guide, Tips & Insights | Learn 2 Trade
Note: Learn2.trade is not a financial advisor. Do your research before investing your funds in any financial asset, product, or event. We are not responsible for your investment results.
- Broker
- Min Deposit
- Score
- Visit Broker

- Award-winning Cryptocurrency trading platform
- $100 minimum deposit,
- FCA & Cysec regulated

- 20% welcome bonus of upto $10,000
- Minimum deposit $100
- Verify your account before the bonus is credited
- Fund Moneta Markets account with a minimum of $250
- Opt in using the form to claim your 50% deposit bonus
Learn to Trade
Never Miss A Trade Again

Signal Notification
Real-time signal notifications whenever a signal is opened, closes or Updated

Get Alerts
Immediate alerts to your email and mobile phone.

Entry Price Levels
Entry price level for every signal Just choose one of our Top Brokers in the list above to get all this free.