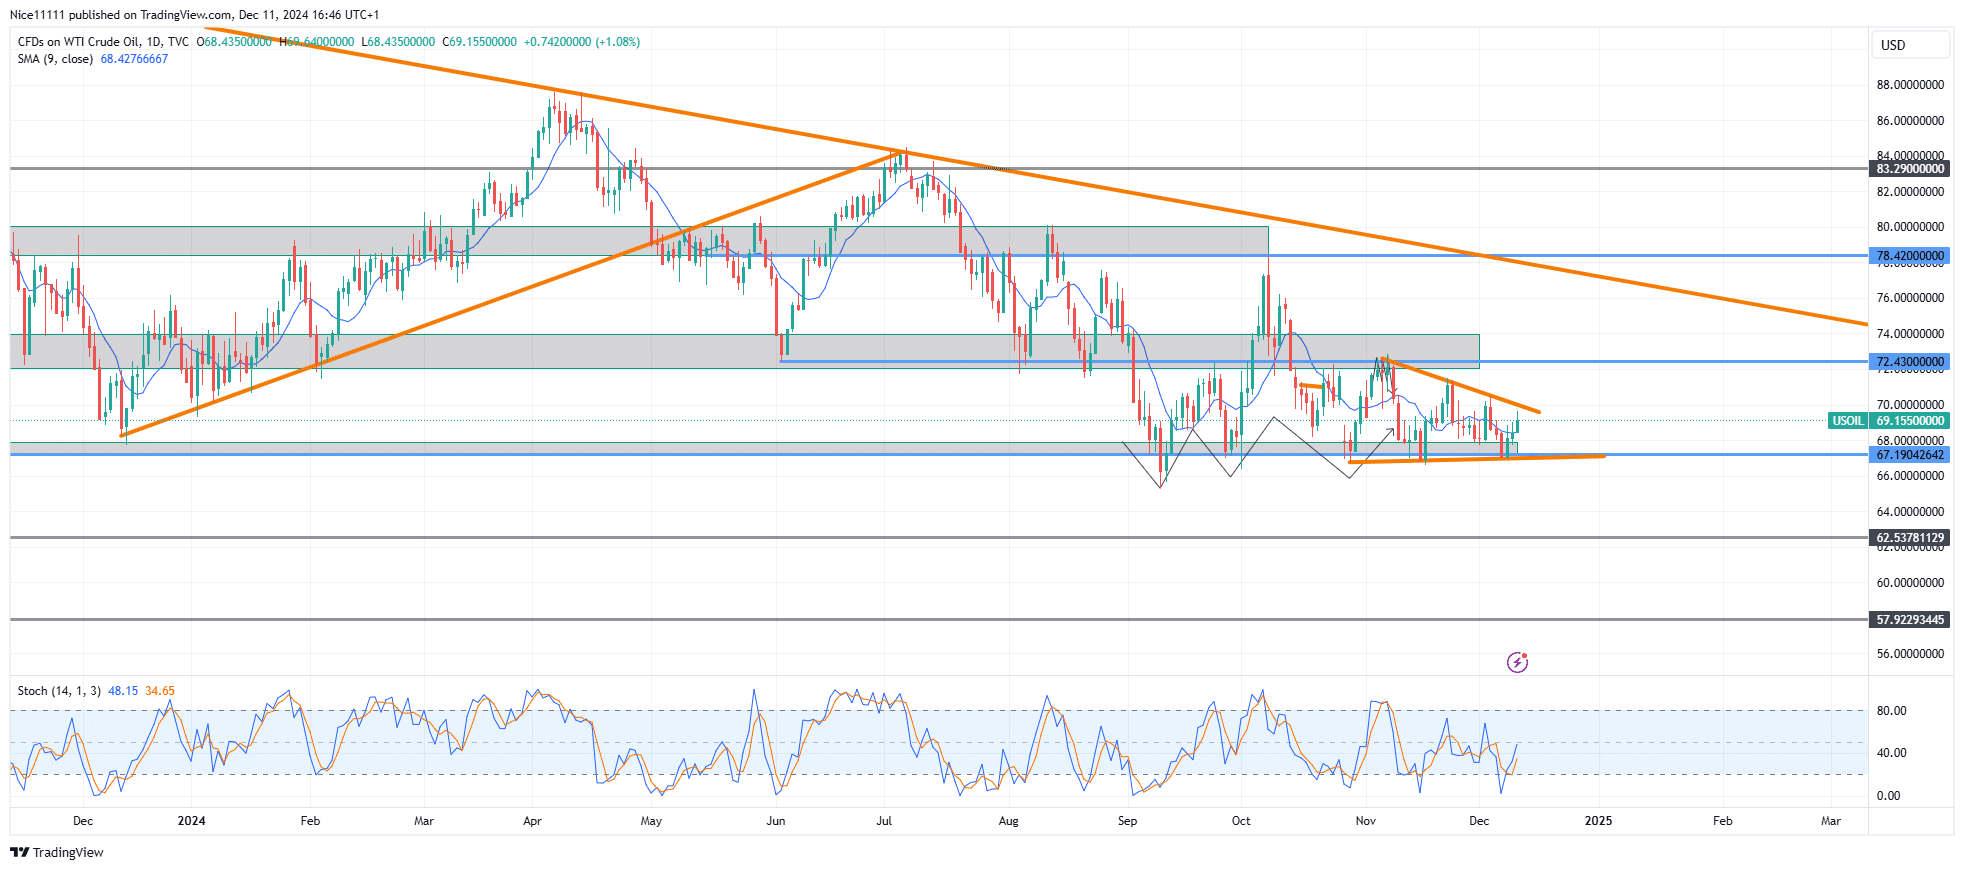
The USOil market is currently experiencing a lack of clear directional momentum, fluctuating within a range defined by the supply zone at 72.430 and the demand zone at 67.190. Within this consolidation phase, the formation of lower highs and equal lows outlines a descending triangle, signaling growing bearish pressure.
The price zone at 72.430, which acted as a significant support region from February to September, initially resisted bearish momentum before eventually giving way under sustained pressure. During this period, repeated price rejections at the zone led to the formation of equal lows, while consistent lower highs established a descending triangle. This pattern reflected intensifying bearish dominance, culminating in a breakdown below the zone.
Currently, USOil remains range-bound. The former demand zone at 72.430 has transitioned into a supply zone, while the support level at 67.190 shows equal lows. However, the continued formation of lower highs within this range emphasizes persistent bearish pressure. A potential breakdown of the 67.190 support level could replicate the bearish breakout observed earlier this year.
USOil Short-Term Trend: Ranging
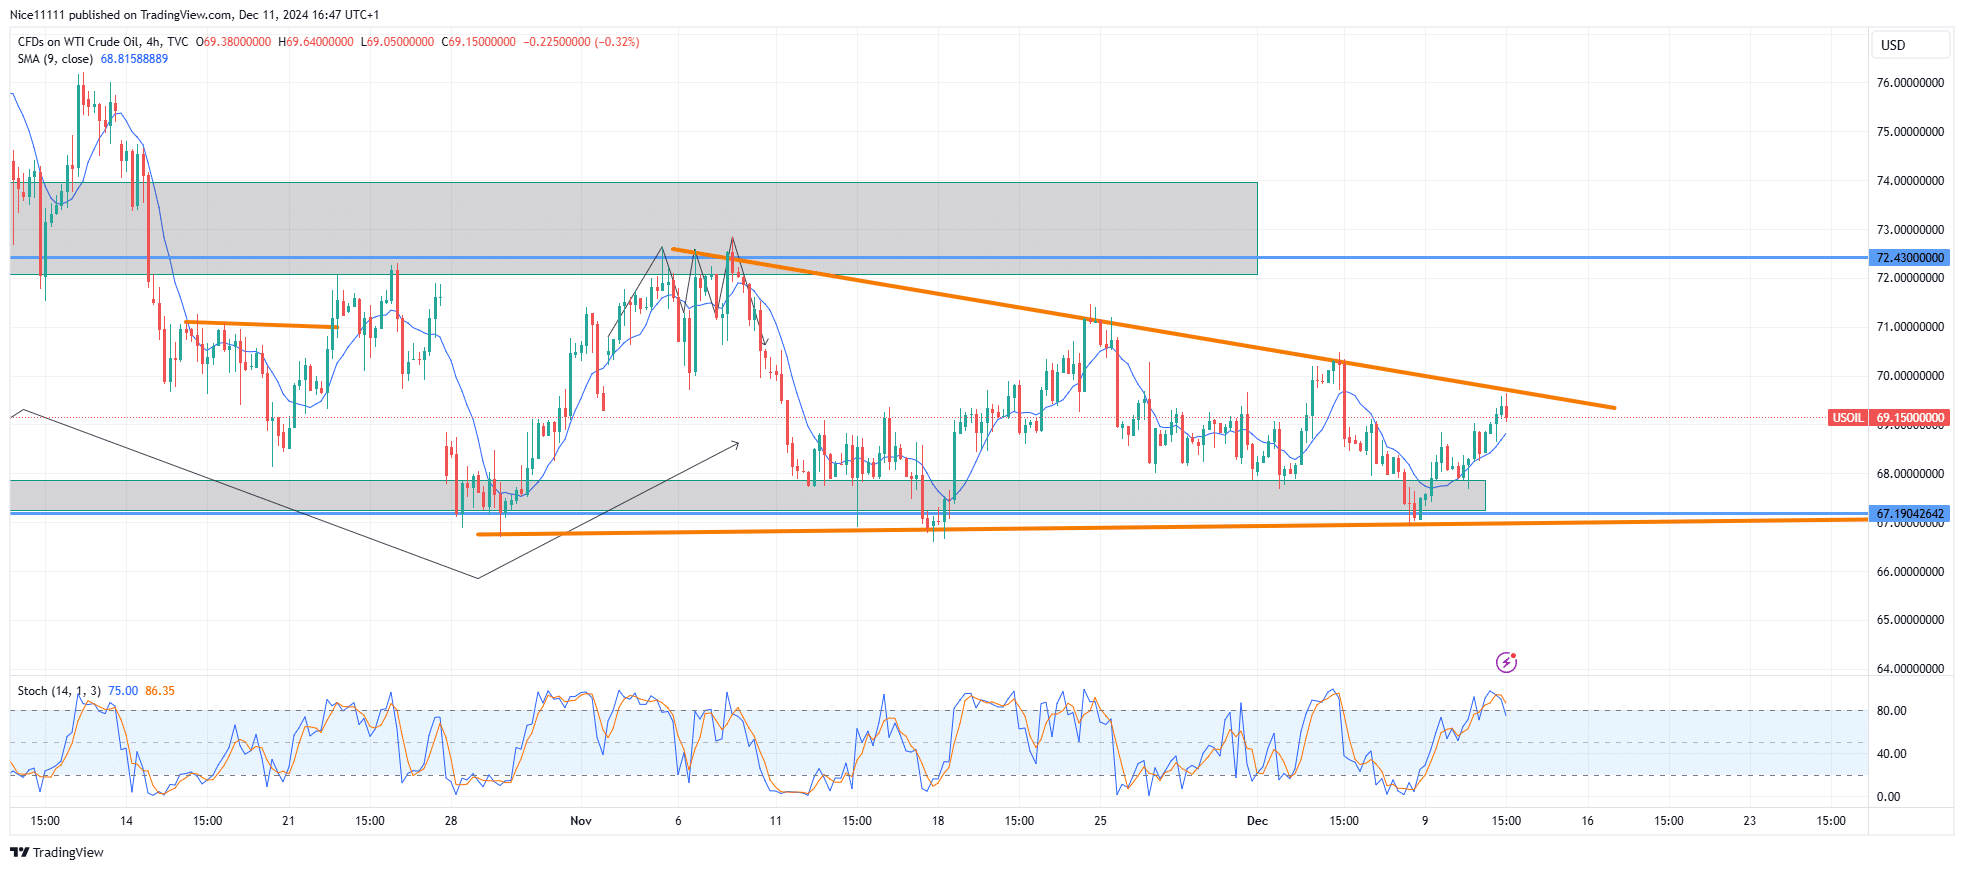
On lower timeframes, price action has rallied toward the downward-sloping trendline of the descending triangle, which now serves as resistance. The Stochastic indicator signals an oversold market, presenting opportunities for scalpers to take short positions near the resistance trendline. Traders relying on forex signals can leverage these setups, particularly in anticipation of a break below the 67.190 support level.
Note: Learn2.trade is not a financial advisor. Do your research before investing your funds in any financial asset, product, or event. We are not responsible for your investment results.
Trade on MT4 with Leverage up to 1:500! Trade on MT4 with Leverage up to 1:500!
X
We use cookies to ensure that we give you the best experience on our website. If you continue to use this site we will assume that you are happy with it.