Market Analysis – May 30
USOil is facing rejection at $61.80 and is signaling a potential downside crash. The daily chart reflects increasing bearish pressure as key technical indicators continue to weaken. The 9-day Simple Moving Average (SMA) at $61.50 is trending flat to slightly lower, acting as dynamic resistance and keeping the price action beneath it. The Relative Strength Index (RSI) is currently at 46.83, positioned below the neutral 50 mark, indicating diminishing momentum with no signs of bullish divergence. The RSI’s repeated inability to enter bullish territory, even during periods of price consolidation, supports a short-term bearish outlook and highlights the lack of accumulation strength at current levels.
USOil Key Levels
Resistance Levels: $61.80, $65.30, $72.20
Support Levels: $55.20, $52.00, $50.10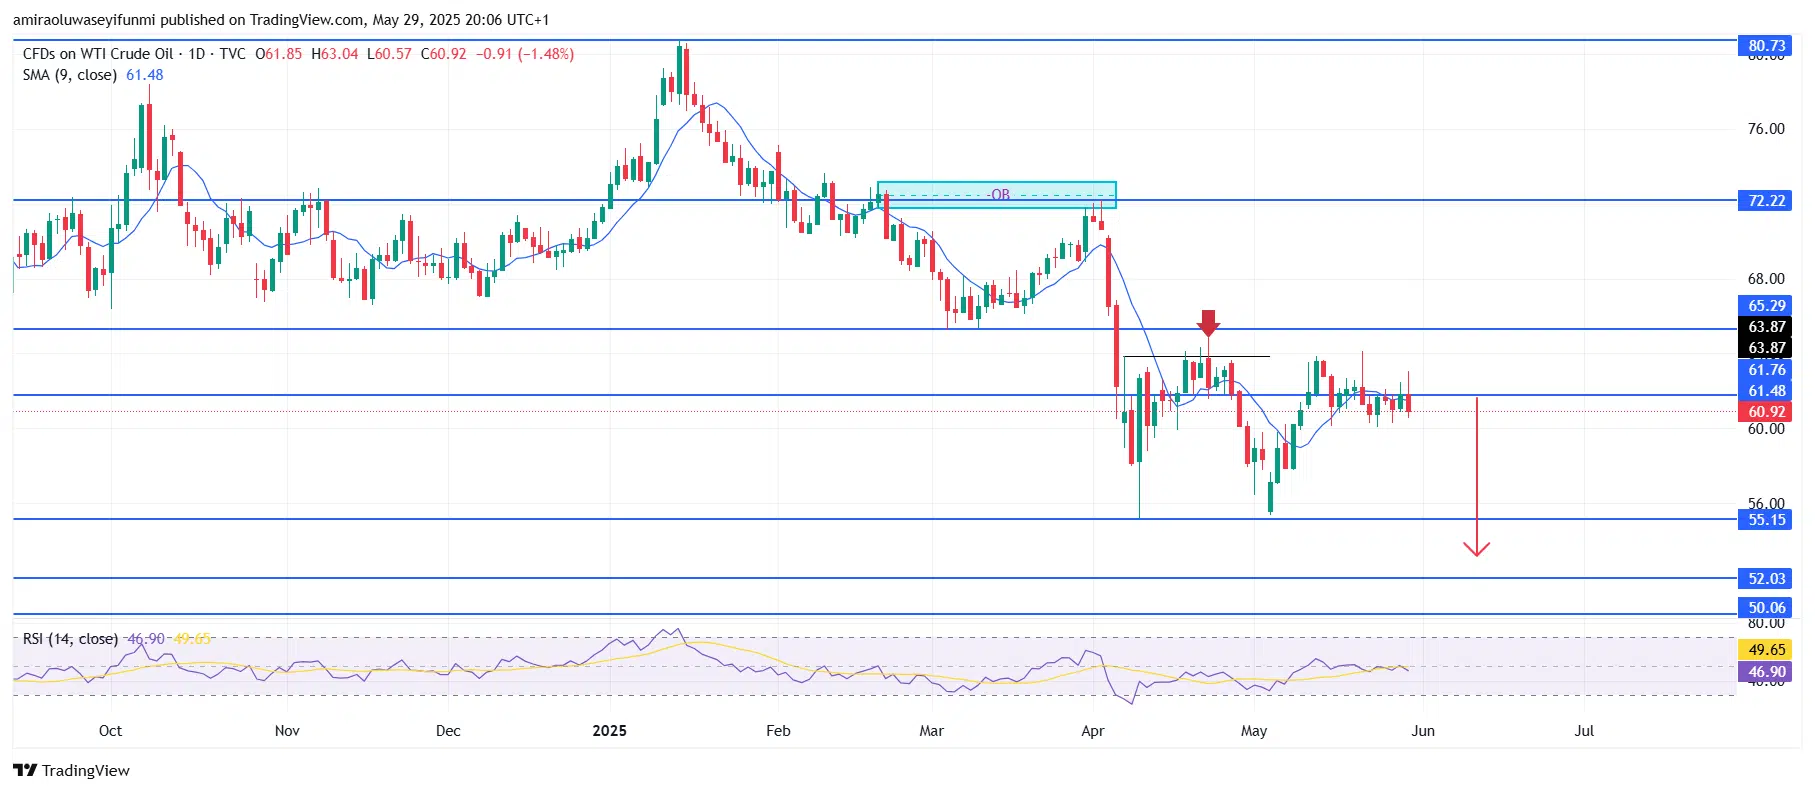
USOil Long-Term Trend: Bearish
Recent price behavior shows that USOil has consistently respected resistance at $65.30 and $61.80, forming lower highs after rejection from these levels. The resistance at $61.80 has been tested multiple times without successful breakout, suggesting waning demand. These repeated failures to close above this level indicate that sellers remain dominant and accumulation remains minimal.
Given the current market structure, a continuation to the downside is likely, particularly if the $55.20 support level fails. A decisive break below this level could drive the price toward $52.00, with extended targets around $50.10 in the medium term. This bearish outlook is further supported by declining upward momentum and the market’s inability to reclaim and hold above the $61.80 level. As long as the price remains below this resistance, downward pressure is expected to persist in upcoming sessions. Traders who rely on forex signals may find this an important confirmation of the prevailing bearish trend.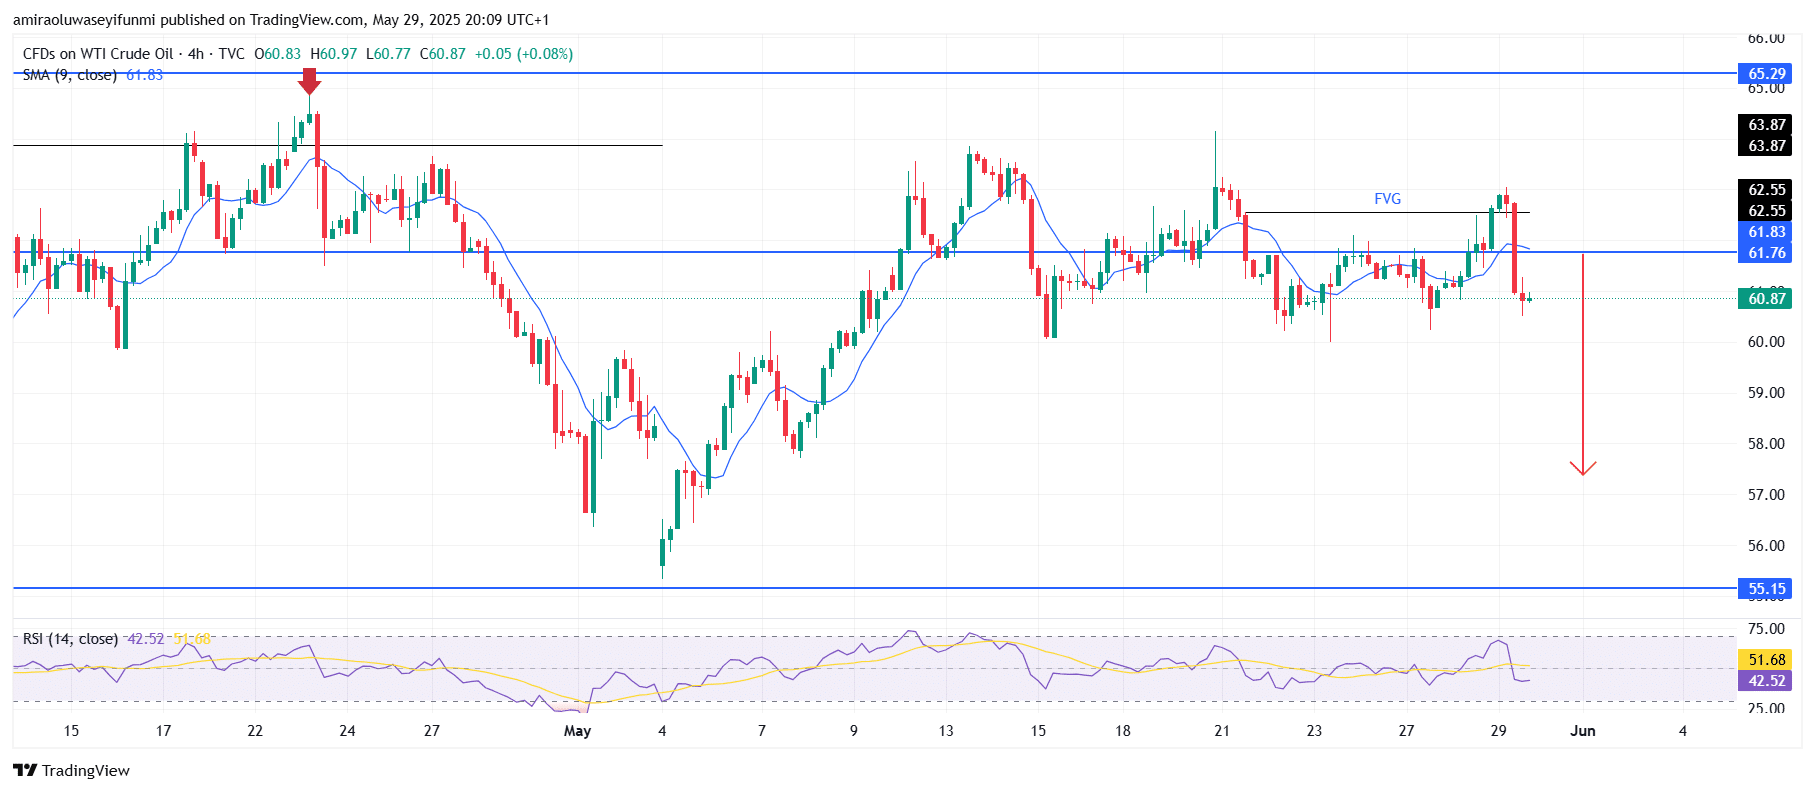
USOil Short-Term Trend: Bearish
On the 4-hour chart, USOil maintains its bearish trend, with price trading below the 9-period SMA and failing to overcome resistance at $61.80. The recent rejection from the Fair Value Gap underscores ongoing selling interest.
The RSI is currently at 42.58, remaining under the neutral 50 level and confirming weak bullish momentum. A sustained drop below the $60.00 mark could accelerate the decline, bringing the $55.20 support zone into sharper focus.
Make money without lifting your fingers: Start using a world-class auto trading solution
How To Buy Lucky Block – Guide, Tips & Insights | Learn 2 Trade
Note: Learn2.trade is not a financial advisor. Do your research before investing your funds in any financial asset, product, or event. We are not responsible for your investment results.
- Broker
- Min Deposit
- Score
- Visit Broker

- Award-winning Cryptocurrency trading platform
- $100 minimum deposit,
- FCA & Cysec regulated

- 20% welcome bonus of upto $10,000
- Minimum deposit $100
- Verify your account before the bonus is credited
- Fund Moneta Markets account with a minimum of $250
- Opt in using the form to claim your 50% deposit bonus
Learn to Trade
Never Miss A Trade Again

Signal Notification
Real-time signal notifications whenever a signal is opened, closes or Updated

Get Alerts
Immediate alerts to your email and mobile phone.

Entry Price Levels
Entry price level for every signal Just choose one of our Top Brokers in the list above to get all this free.