Market Analysis – April 11
USOil is facing rejection as bearish momentum gains strength. On the daily chart, the Moving Average Convergence Divergence (MACD) indicator highlights persistent downward pressure. The MACD line remains below the signal line, with both sloping downward, confirming sustained selling interest. Additionally, the histogram continues to display negative bars, indicating that momentum remains in favor of the bears. The 9-day Simple Moving Average (SMA), currently at $63.640, acts as dynamic resistance following the recent decline. This moving average has yet to be reclaimed, underscoring the prevailing downtrend.
USOil Key Levels
Resistance Levels: $72.00, $80.70, $84.50
Support Levels: $65.30, $61.80, $55.20
USOil Long-Term Trend: Bearish
Price action shows that USOil recently attempted to breach the $72.00 resistance zone in late March 2025. However, the effort was decisively rejected at that level, marked by a clear order block and a pronounced upper wick, signaling strong selling interest. Following the rejection, price fell sharply, breaking below significant Fibonacci retracement levels at $68.00 (0.618) and $65.70 (0.786), before finding temporary support around $55.20. The recent rebound has stalled at the $61.80 mark, which aligns with a former support structure. The overall market structure remains bearish, characterized by consistently lower highs and lower lows.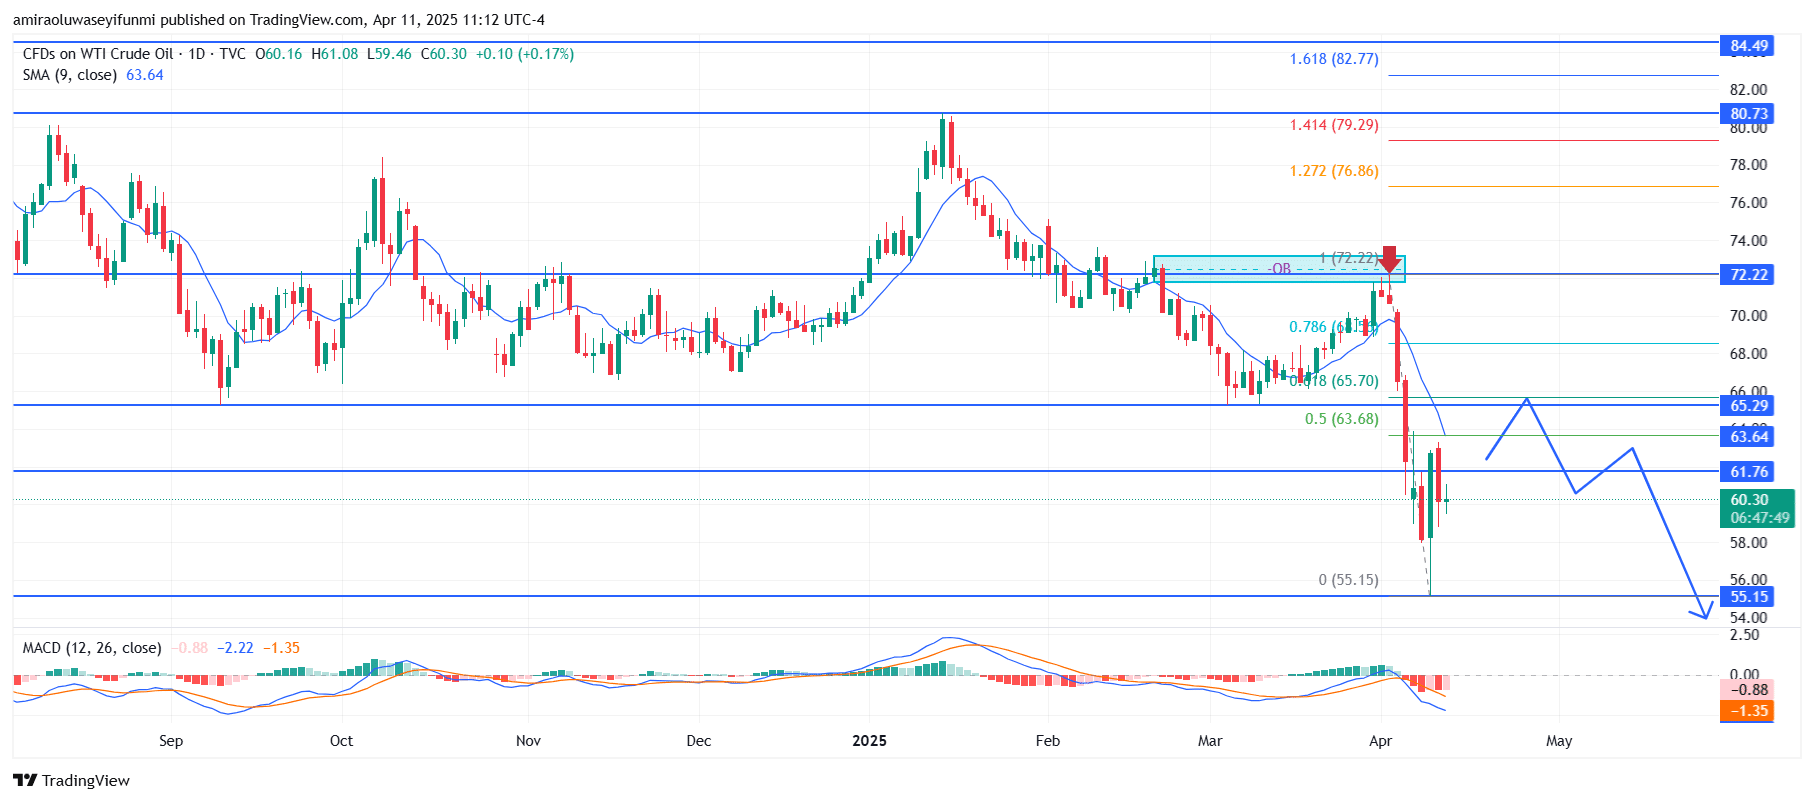
Looking forward, a potential retest of the $65.30 area is anticipated, which may act as a short-term supply zone before the price resumes its downward movement. Should sellers reassert control at this level, the downtrend could continue toward $61.80 and possibly revisit the $55.20 support. A confirmed break below $55.20 could pave the way for further downside, particularly if global economic or geopolitical factors continue to impact oil demand. Unless price reclaims $65.30 and begins forming higher lows, the broader trend remains firmly bearish. Traders leveraging forex signals may monitor this resistance zone for potential entries.
USOil Short-Term Trend: Bullish
In the 4-hour timeframe, USOil is currently exhibiting short-term bullish momentum, rebounding strongly from the order block located between $57.50 and $58.50. The price is now trading above the 9-period SMA, reflecting near-term upward strength.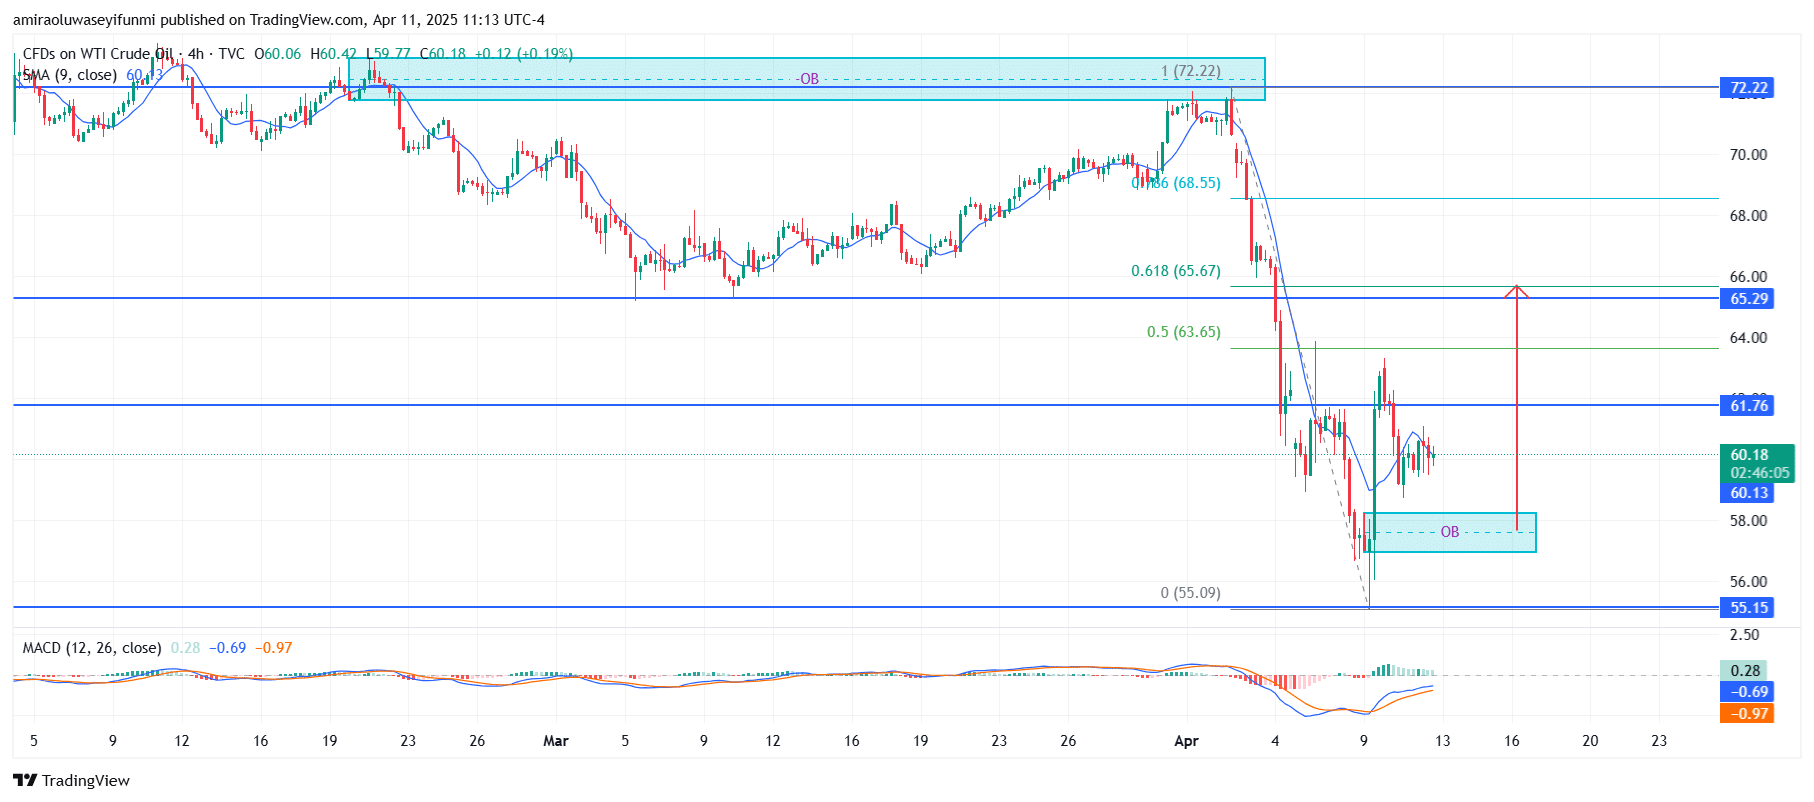
Make money without lifting your fingers: Start using a world-class auto trading solution
How To Buy Lucky Block – Guide, Tips & Insights | Learn 2 Trade
Note: Learn2.trade is not a financial advisor. Do your research before investing your funds in any financial asset, product, or event. We are not responsible for your investment results.
- Broker
- Min Deposit
- Score
- Visit Broker

- Award-winning Cryptocurrency trading platform
- $100 minimum deposit,
- FCA & Cysec regulated

- 20% welcome bonus of upto $10,000
- Minimum deposit $100
- Verify your account before the bonus is credited
- Fund Moneta Markets account with a minimum of $250
- Opt in using the form to claim your 50% deposit bonus
Learn to Trade
Never Miss A Trade Again

Signal Notification
Real-time signal notifications whenever a signal is opened, closes or Updated

Get Alerts
Immediate alerts to your email and mobile phone.

Entry Price Levels
Entry price level for every signal Just choose one of our Top Brokers in the list above to get all this free.