Market Analysis – February 21
USOil is poised for a bullish reversal as indicators approach the oversold state. The 9-day simple moving average (SMA) is currently at $71.560, with the price dipping below this level, indicating temporary bearish pressure. The Relative Strength Index (RSI) stands at 41.31, nearing oversold territory, suggesting that selling momentum may be waning. Despite the recent decline, the RSI’s previous rebound from lower levels signals potential for a recovery if buyers step in at key support levels. A move back above the SMA would confirm renewed bullish momentum.
USOil Key Levels
Resistance Levels: $77.260, $84.490, $87.600
Support Levels: $67.100, $65.300, $61.760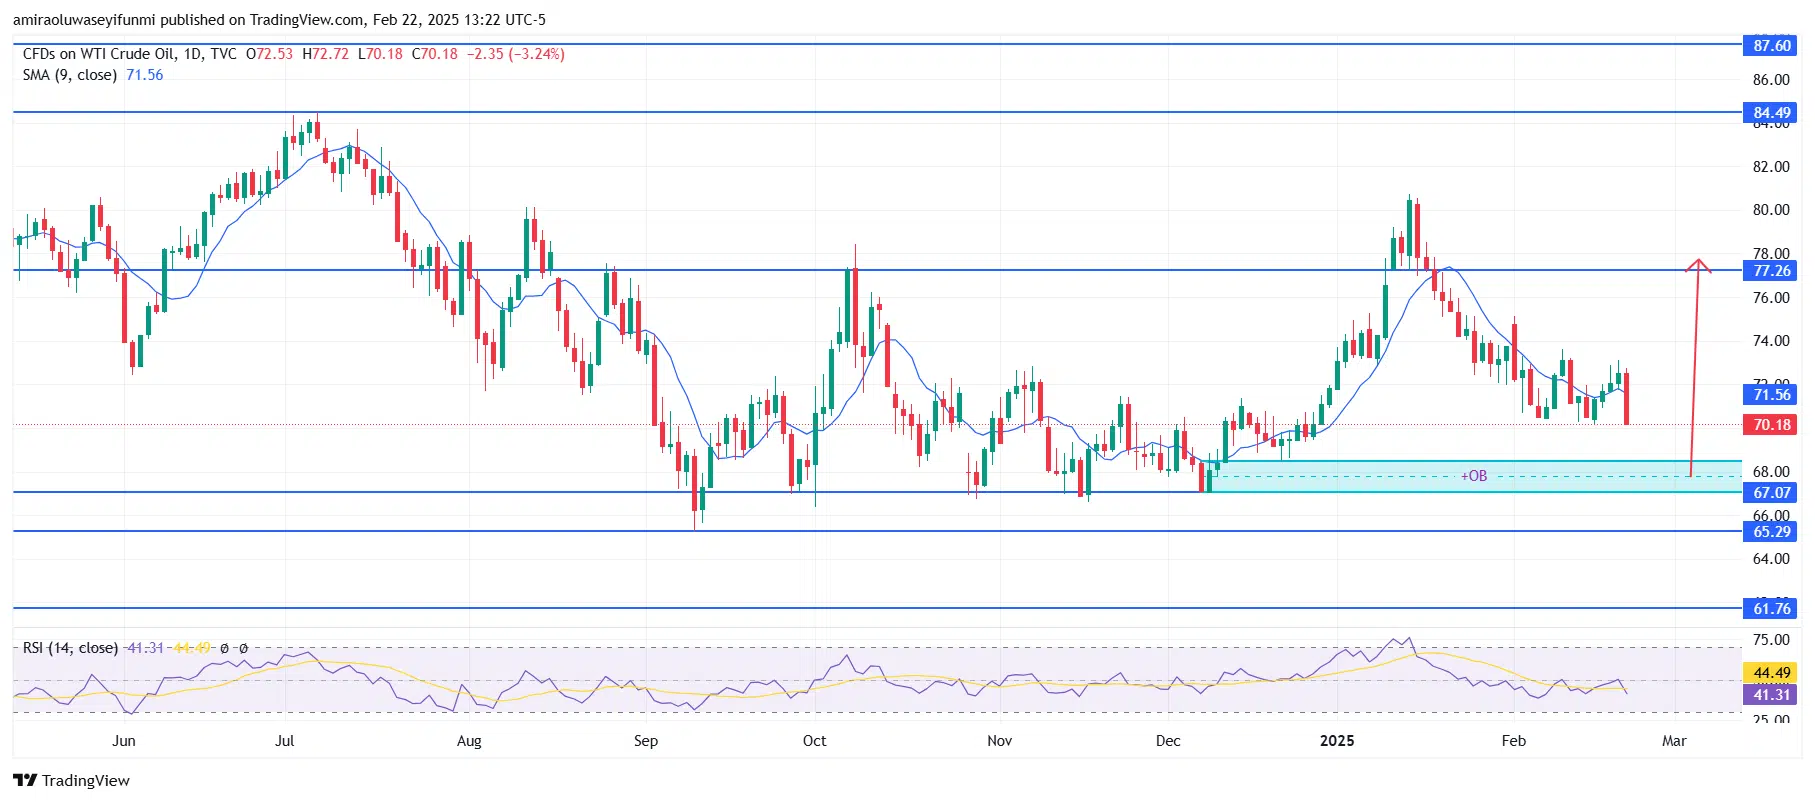
USOil Long-Term Trend: Bullish
Price action indicates that USOil has pulled back into a strong demand zone between $69.000 and $67.000, an area where previous reversals have taken place. This zone aligns with an order block that has previously triggered significant bullish movements. The recent decline tested this level, and a price rejection here could confirm strong buying interest. The nearest resistance level is $77.260, aligning with prior swing highs and serving as a key target for bullish continuation.
If buyers defend the $69.000 – $67.000 region, USOil could experience a strong rally toward $77.260. A breakout above this level would pave the way for an advance toward $84.490 and potentially $87.600. However, if the price fails to hold this demand zone, further declines toward $61.760 could occur. For now, bullish momentum remains likely as long as the key support zone holds.
USOil Short-Term Trend: Bearish
The 4-hour USOil chart remains bearish, with the price trading below the 9-period SMA at $71.950. A descending trendline continues to act as dynamic resistance, reinforcing selling pressure on lower highs. Price is approaching the daily bullish order block, where previous buying activity was observed. If this order block fails, further downside toward $61.760 could be expected. However, a strong recovery from this level could signal a shift in momentum, supported by forex signals indicating potential bullish pressure.
Make money without lifting your fingers: Start using a world-class auto trading solution
How To Buy Lucky Block – Guide, Tips & Insights | Learn 2 Trade
Note: Learn2.trade is not a financial advisor. Do your research before investing your funds in any financial asset, product, or event. We are not responsible for your investment results.
- Broker
- Min Deposit
- Score
- Visit Broker

- Award-winning Cryptocurrency trading platform
- $100 minimum deposit,
- FCA & Cysec regulated

- 20% welcome bonus of upto $10,000
- Minimum deposit $100
- Verify your account before the bonus is credited


- Fund Moneta Markets account with a minimum of $250
- Opt in using the form to claim your 50% deposit bonus