Key Resistance Levels: $80.00, $84.00, $88.00
Key Support Levels: $66.00,$62.200,$58.00
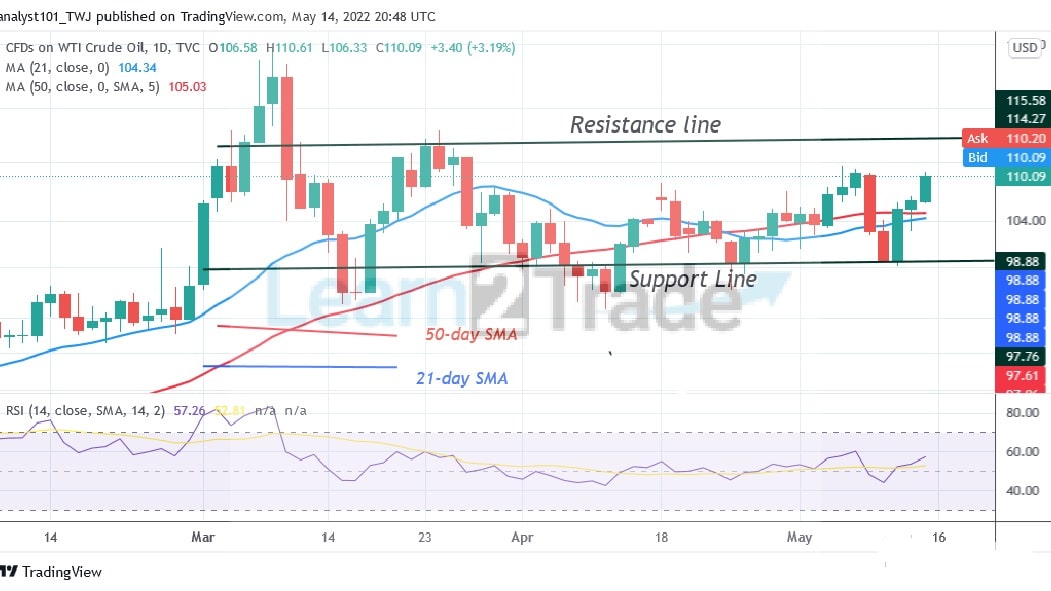
USOIL (WTI) Long-term Trend: Ranging
USOIL price is in a sideways trend since March 22 as it faces rejection at $110.58 . The index has been fluctuating between $98 and $115 price levels. Today, the upward move has reached the high of $110.61 but faces rejection at the resistance zone. In the previous price action, the index declined from the high of $111.34 and retested the lower price range. In the meantime, the market is facing resistance at the recent high. The index will trend when the range-bound levels are breached.
Daily Chart Indicators Reading:
USOIL is at level 57 of the Relative Strength Index for period 14. It is in the uptrend zone but it is facing resistance at the recent high. The 21-day SMA and the 50 –day SMA are sloping horizontally indicating a sideways trend.
USOIL (WTI) Medium-term bias: Bearish
On the 4-hour chart, the index is in an uptrend as the market reaches the high of $110.58. The index is facing rejection at the resistance zone
Meanwhile, on May 11 uptrend; a retraced candle body tested the 61.8 Fibonacci retracement level. The retracement suggests that the index will rise to level 1.618 Fibonacci extension or level $110.74. From the price action, the market has reached the 1.618 Fibonacci extension and it is likely to reverse.
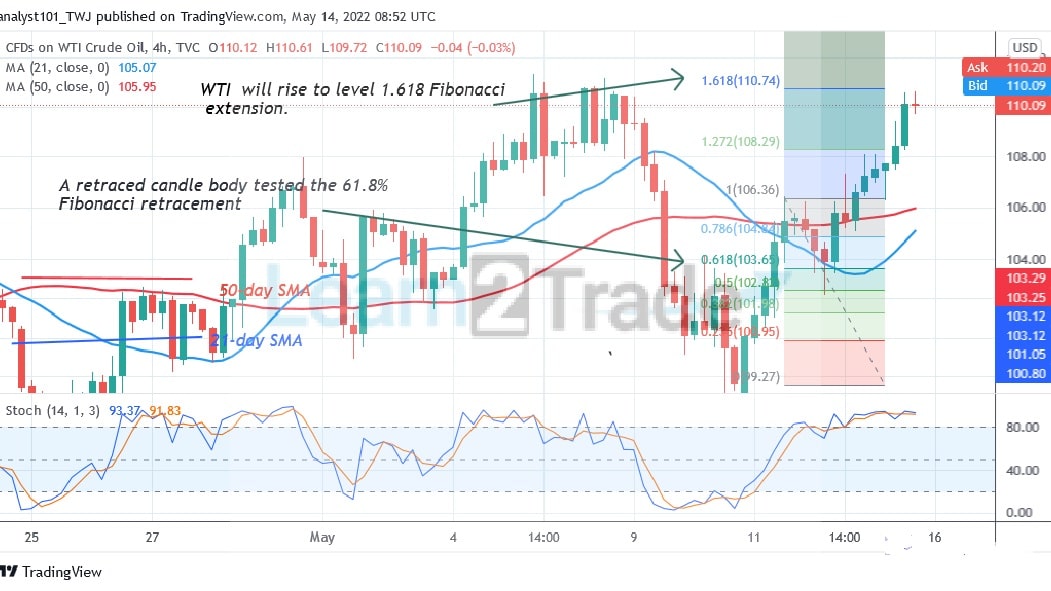
4-hour Chart Indicators Reading
WTI is above the 80% range of the daily stochastic. The market has reached the overbought region. The index has reached bullish exhaustion. The 21-day and 50-day SMAs are sloping upward indicating the uptrend. WTI price bars are above the moving averages indicating a possible rise in the index.
General Outlook for USOIL (WTI)
USOIL (WTI) is in an upward move as it faces rejection at $110.58 . Sellers will emerge in the overbought region to push prices down. The market has been reversing at the overbought region since May 6.
You can purchase crypto coins here: Buy LBlock
Note: Learn2Trade is not a financial advisor. Do your research before investing your funds in any financial asset or presented product or event. We are not responsible for your investing results
- Broker
- Min Deposit
- Score
- Visit Broker

- Award-winning Cryptocurrency trading platform
- $100 minimum deposit,
- FCA & Cysec regulated

- 20% welcome bonus of upto $10,000
- Minimum deposit $100
- Verify your account before the bonus is credited
- Fund Moneta Markets account with a minimum of $250
- Opt in using the form to claim your 50% deposit bonus
Learn to Trade
Never Miss A Trade Again

Signal Notification
Real-time signal notifications whenever a signal is opened, closes or Updated

Get Alerts
Immediate alerts to your email and mobile phone.

Entry Price Levels
Entry price level for every signal Just choose one of our Top Brokers in the list above to get all this free.