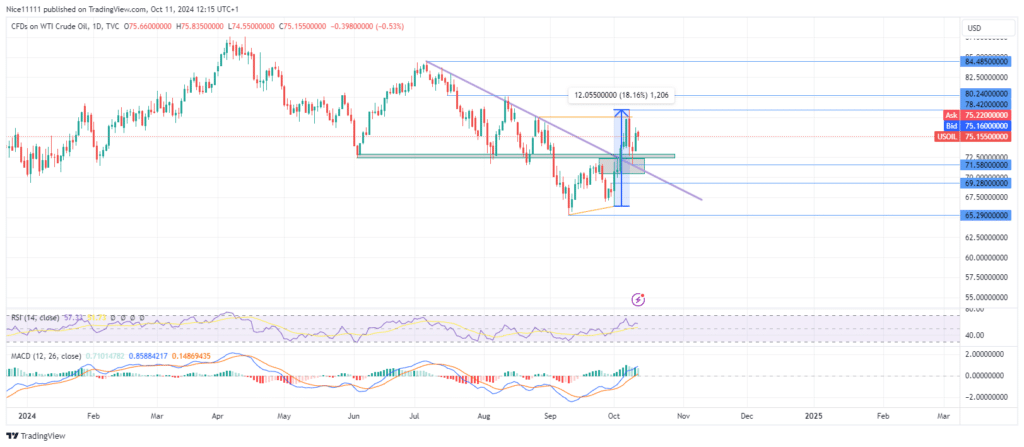
The USOil index has recently made a decisive move into bullish territory, breaking out from a key resistance zone and an overarching trendline. After this breakout, the price retraced to the zone for a retest, reinforcing the current upward momentum.
A double bottom pattern signaled a potential reversal, with a failed low observed on October 1. The key level at 72.500, which previously acted as resistance on September 24, was breached along with the descending trendline, confirming a bullish breakout. This USOil price movement saw an 18.16% gain within five days, eventually pulling back upon reaching 78.420 to retest both the trendline and the 72.500 zone, creating a strong bullish confluence.
The MACD (Moving Average Convergence and Divergence) indicator shows increasing bullish momentum, as evidenced by the growing histogram, while the RSI (Relative Strength Index) confirms a strong uptrend, curving positively above the 50 level.
USOil Short-Term Trend: Bullish
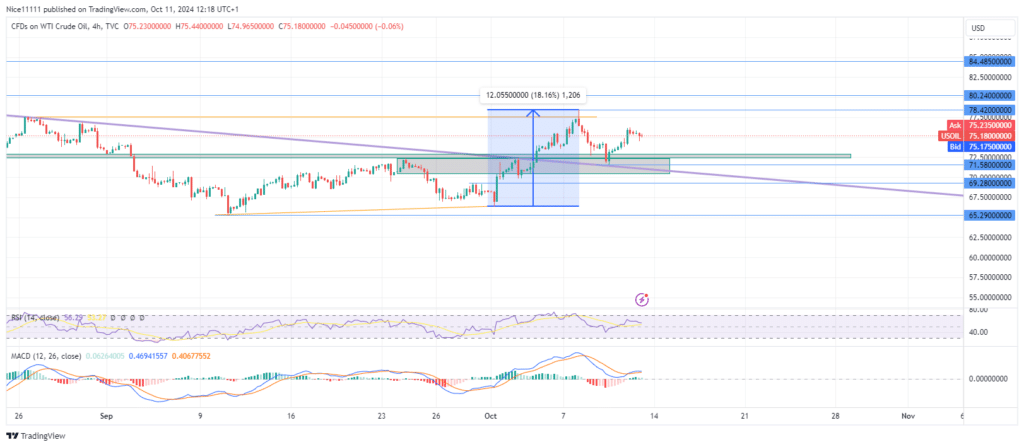
The bullish trend continued after the retest at the 72.500 confluence zone, with a clear Break of Structure (BOS) confirming the upward price direction. Currently, on the 4-hour chart, the price has retraced to a bullish order block, reinforcing the momentum as it aims for the next resistance at 78.420. Many forex signals point to this level as a critical area for traders to monitor.
Note: Learn2.trade is not a financial advisor. Do your research before investing your funds in any financial asset, product, or event. We are not responsible for your investment results.
Trade on MT4 with Leverage up to 1:500! Trade on MT4 with Leverage up to 1:500!
X
We use cookies to ensure that we give you the best experience on our website. If you continue to use this site we will assume that you are happy with it.