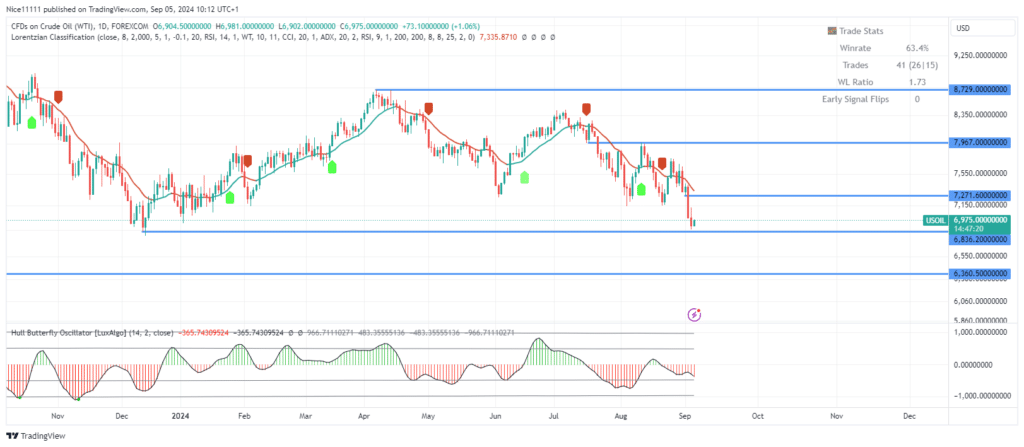
USOil index continues its downward movement, heading toward the key demand zone near the swing low of 6836.0. The price action on the daily chart is evident, with the market structure showing a consistent pattern of lower highs and lower lows, confirming a strong bearish trend.
The long-term trend for USOil index remains firmly bearish, with bearish order blocks significantly influencing the ongoing downtrend. Tests of supply at the 7967.0 and 7271.0 levels have reinforced this bearish momentum, as each test led to a break in market structure, further solidifying the downward bias.
In late August, the Machine Learning Lorentzian Classification indicator signaled a sell, aligning perfectly with the overall bearish trend. The Hull Butterfly indicator, which monitors trend direction, also confirms the prevailing downtrend, giving traders additional confidence in the bearish outlook. Forex signals further highlight similar patterns in related markets, suggesting a sustained downtrend across sectors.
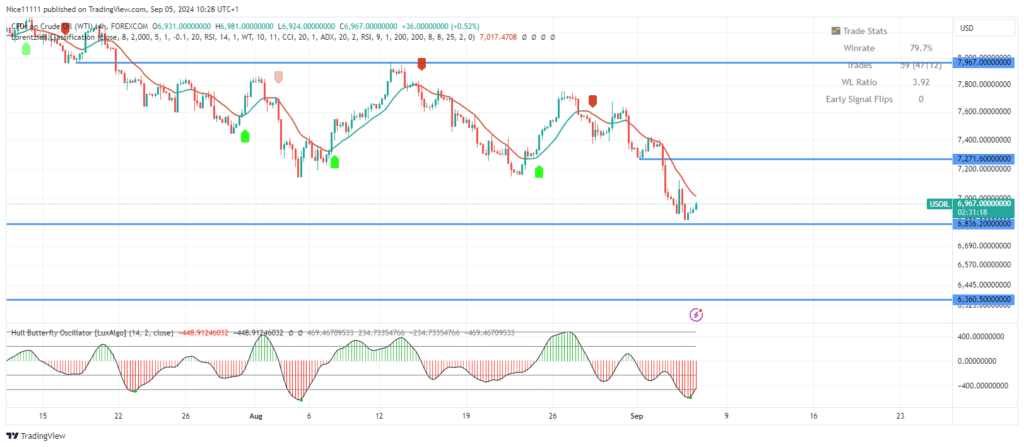
USOil Short-term Trend: Bearish
In the short term, it appears the bears are becoming overstretched, which could lead to a temporary pullback. A retracement may help refresh selling momentum, enabling the price to resume its descent toward the 6836.0 level. This target zone holds strong potential for forex signals due to the rich liquidity in the area, fueled by the presence of relatively equal lows, making it a key focus for traders.
Note: Learn2.trade is not a financial advisor. Do your research before investing your funds in any financial asset, product, or event. We are not responsible for your investment results.
Trade on MT4 with Leverage up to 1:500! Trade on MT4 with Leverage up to 1:500!
X
We use cookies to ensure that we give you the best experience on our website. If you continue to use this site we will assume that you are happy with it.