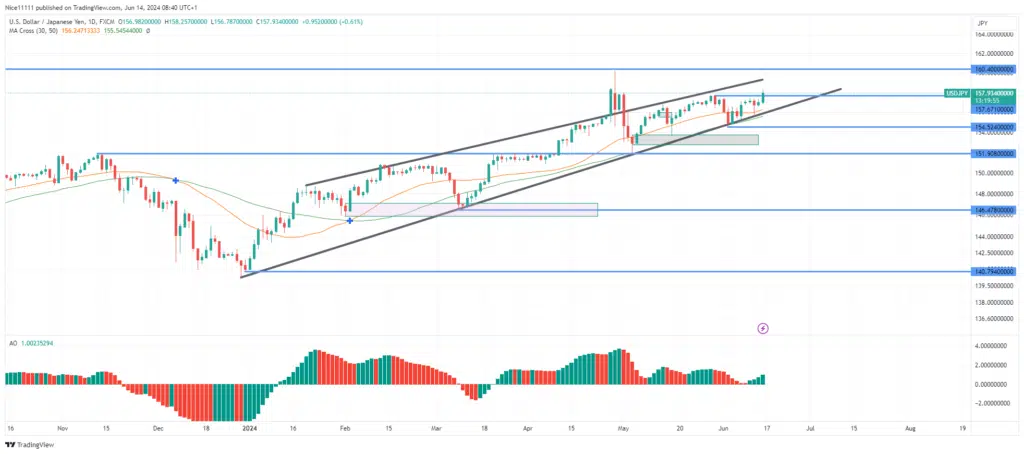
USDJPY – Guide, Tips & Insights | Learn 2 Trade – Guide, Tips & Insights | Learn 2 Trade is steadily approaching the current year’s high of 160.210 after experiencing a major pullback in May. Since then, the pair has shown a strong recovery, with higher lows consistently forming, indicating a robust bullish trend. This upward momentum has been driving the price towards this significant level, showcasing buyers’ clear and sustained effort to push the currency pair to new highs.
The USDJPY – Guide, Tips & Insights | Learn 2 Trade – Guide, Tips & Insights | Learn 2 Trade market has maintained an uptrend throughout the year. Notably, price action has shown a clear pattern, with major lows leading to major highs. This pattern has established a bullish market structure.
In April, the market experienced a significant price crash from 160.210 to 151.900. However, the pullback paused after testing the bullish order block at 151.900. Currently, buyers have established a bullish break of structure. The Hull Butterfly Indicator shows increasing momentum. The swing high of 160.210 is likely to be taken out shortly, as the Parabolic SAR (Stop and Reverse) supports the bullish stance.
The price ascent on the daily chart began with a double-bottom bullish reversal pattern. This occurred when the Hull Butterfly Indicator signaled an oversold market. Consequently, the price is expected to strike and push through the resistance zone of 160.210. As a result, bullish momentum continues to rise.
Note: Learn2.trade is not a financial advisor. Do your research before investing your funds in any financial asset or presented product or event. We are not responsible for your investing results.
Trade on MT4 with Leverage up to 1:500! Trade on MT4 with Leverage up to 1:500!
X
We use cookies to ensure that we give you the best experience on our website. If you continue to use this site we will assume that you are happy with it.

 USDJPY – Guide, Tips & Insights | Learn 2 Trade – Guide, Tips & Insights | Learn 2 Trade Short-term Trend: Bullish
 USDJPY – Guide, Tips & Insights | Learn 2 Trade – Guide, Tips & Insights | Learn 2 Trade Short-term Trend: Bullish


