Market Analysis – January 12
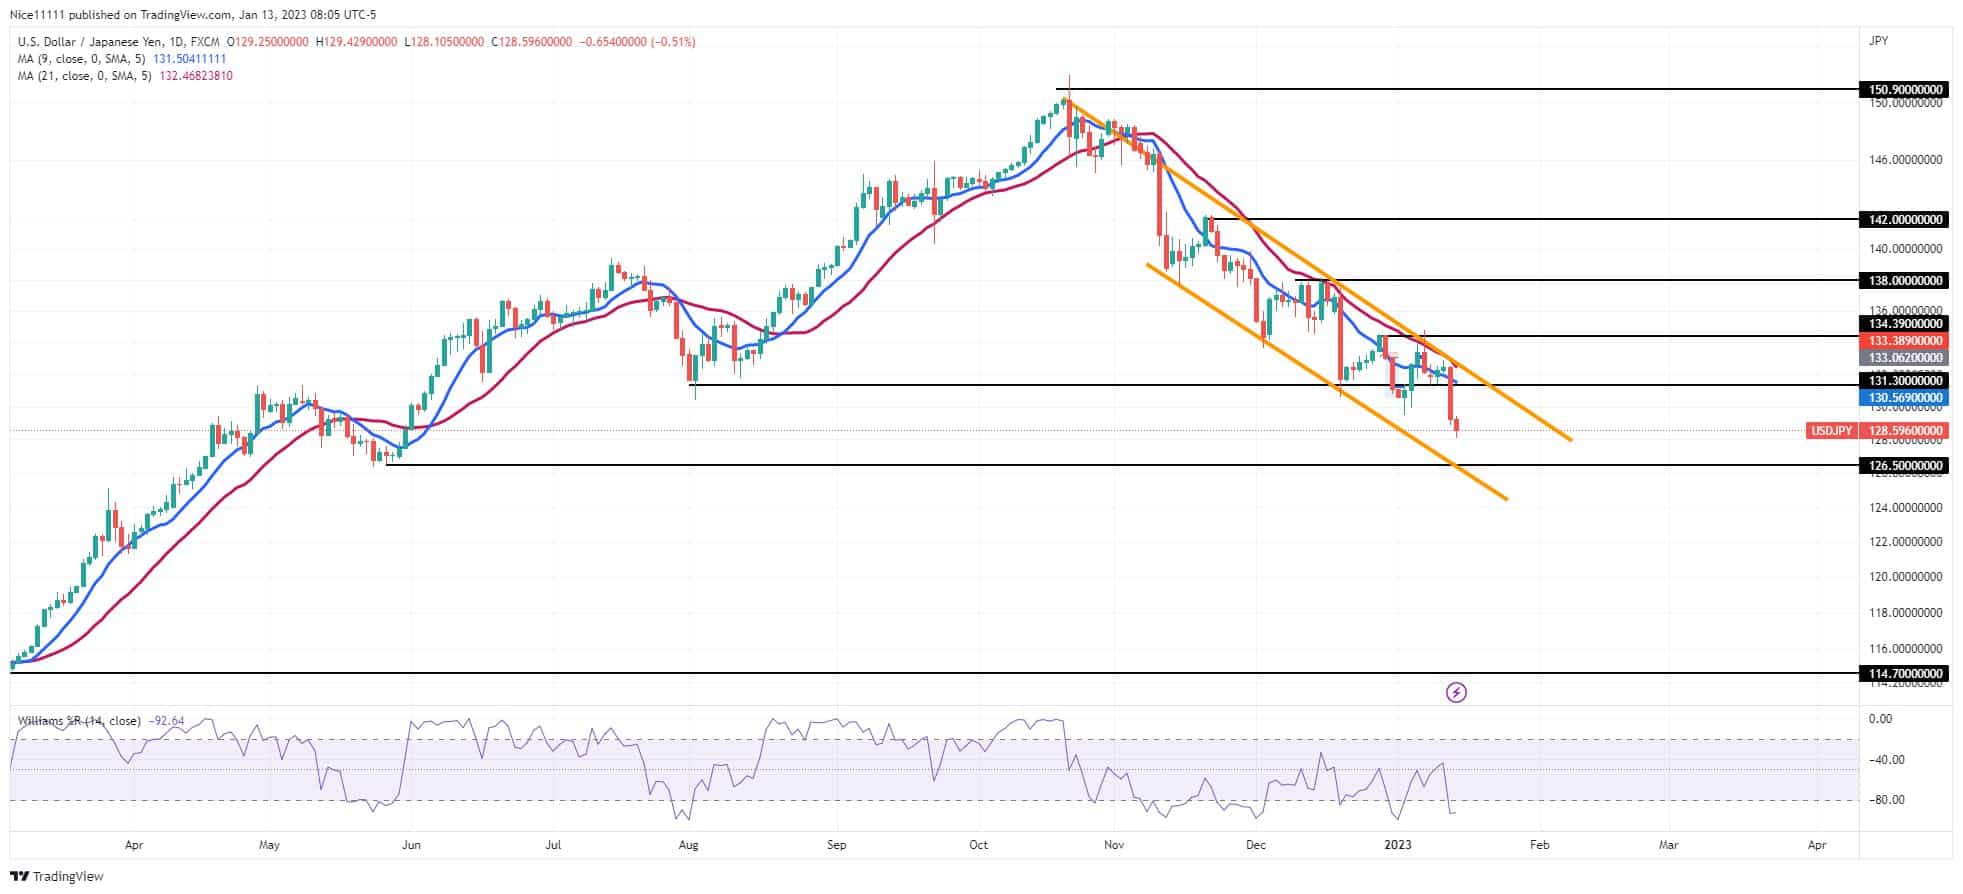
USDJPY – Guide, Tips & Insights | Learn 2 Trade – Guide, Tips & Insights | Learn 2 Trade was very bullish until the buyers struck the supply level of 150.00. The market was trending higher on the daily chart from April to November. In June, the market declined to an oversold level. The Moving Averages (periods nine and twenty-one) crossed twice to show a retracement and a quick recovery of the bulls. The market rose from a 126.50 demand level.
USDJPY – Guide, Tips & Insights | Learn 2 Trade – Guide, Tips & Insights | Learn 2 Trade Key Levels
Supply Levels: 150.900, 142.000, 138.000
Demand Levels: 131.300, 126.500, 114.700
The second retracement occurred in August. The Williams Percent R indicates the market has dived into an oversold region. At the 131.30 demand level, a double-bottom reversal structure was visible. The prices crashed as the supply level of 150.90 was reached. The Moving Averages switched positions. In order to close below the 21-day moving average, the price declined.
USDJPY – Guide, Tips & Insights | Learn 2 Trade – Guide, Tips & Insights | Learn 2 Trade Short-term Trend: Bearish
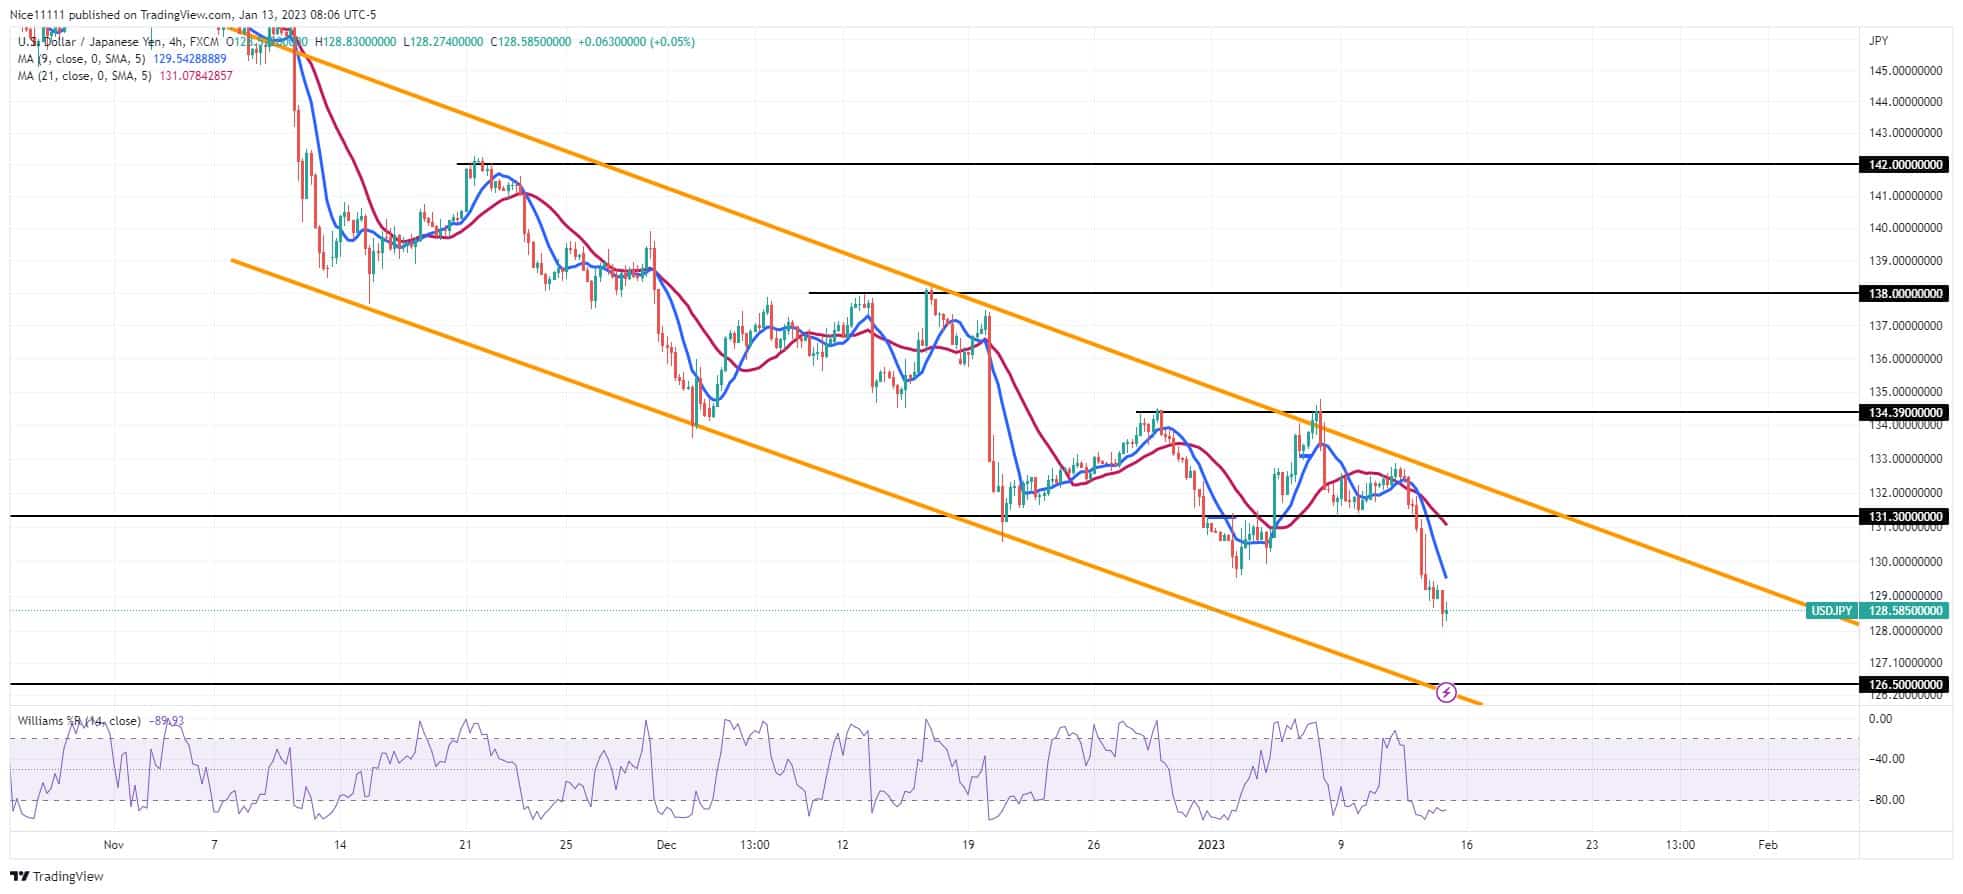
A bearish channel guided the market to the support levels. A triple top at 138.00 fostered a sell-off. The Bears also repositioned themselves at 134.390, resulting in a massive bearish displacement. The market is currently oversold. The market is expected to retrace back to 131.300 to resume the downtrend.
Do you want to take your trading to the next level? Join the best platform for that here
- Broker
- Min Deposit
- Score
- Visit Broker

- Award-winning Cryptocurrency trading platform
- $100 minimum deposit,
- FCA & Cysec regulated

- 20% welcome bonus of upto $10,000
- Minimum deposit $100
- Verify your account before the bonus is credited
- Fund Moneta Markets account with a minimum of $250
- Opt in using the form to claim your 50% deposit bonus
Learn to Trade
Never Miss A Trade Again

Signal Notification
Real-time signal notifications whenever a signal is opened, closes or Updated

Get Alerts
Immediate alerts to your email and mobile phone.

Entry Price Levels
Entry price level for every signal Just choose one of our Top Brokers in the list above to get all this free.