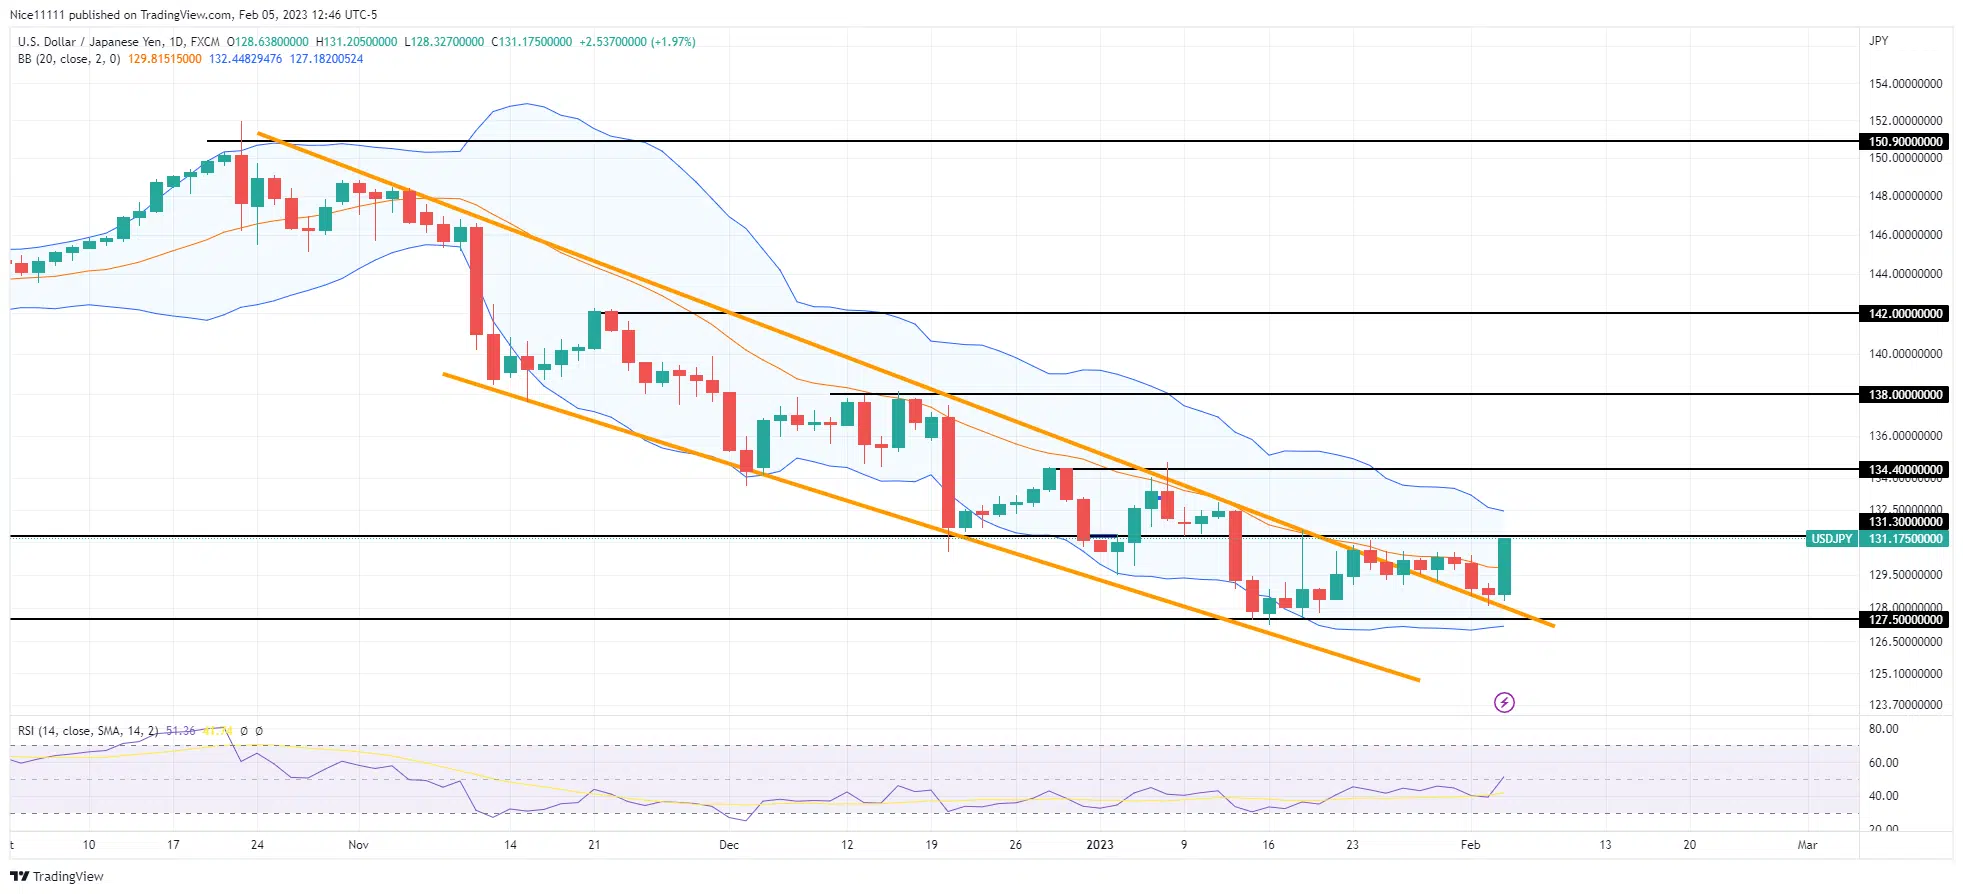
The USD/JPY experienced a bearish shift in market structure at the 150.90 supply level. The RSI (Relative Strength Index) declared an overbought market. The daily candles dropped below the Moving Averages within the Bollinger Bands to signify bearishness. The counter-trend moves appeared to be lethargic. Each corrective motion was followed by a bearish displacement. The bearish parallel channel guided the candlestick as the market declined. The close of the candlesticks rested beneath the Moving Averages within the Bollinger Bands all through November and into late January.
The price action is currently showing reversal signs on USDJPY – Guide, Tips & Insights | Learn 2 Trade – Guide, Tips & Insights | Learn 2 Trade. The bearish parallel channel has been broken. The daily candles have risen above the resistance trendline. A major bullish candle is also positioned above the Bollinger Mid String to show a sign of bullishness. A double bottom pattern has formed on the daily chart. The RSI (Relative Strength Index) is also positive, indicating that the USD/JPY is in demand.
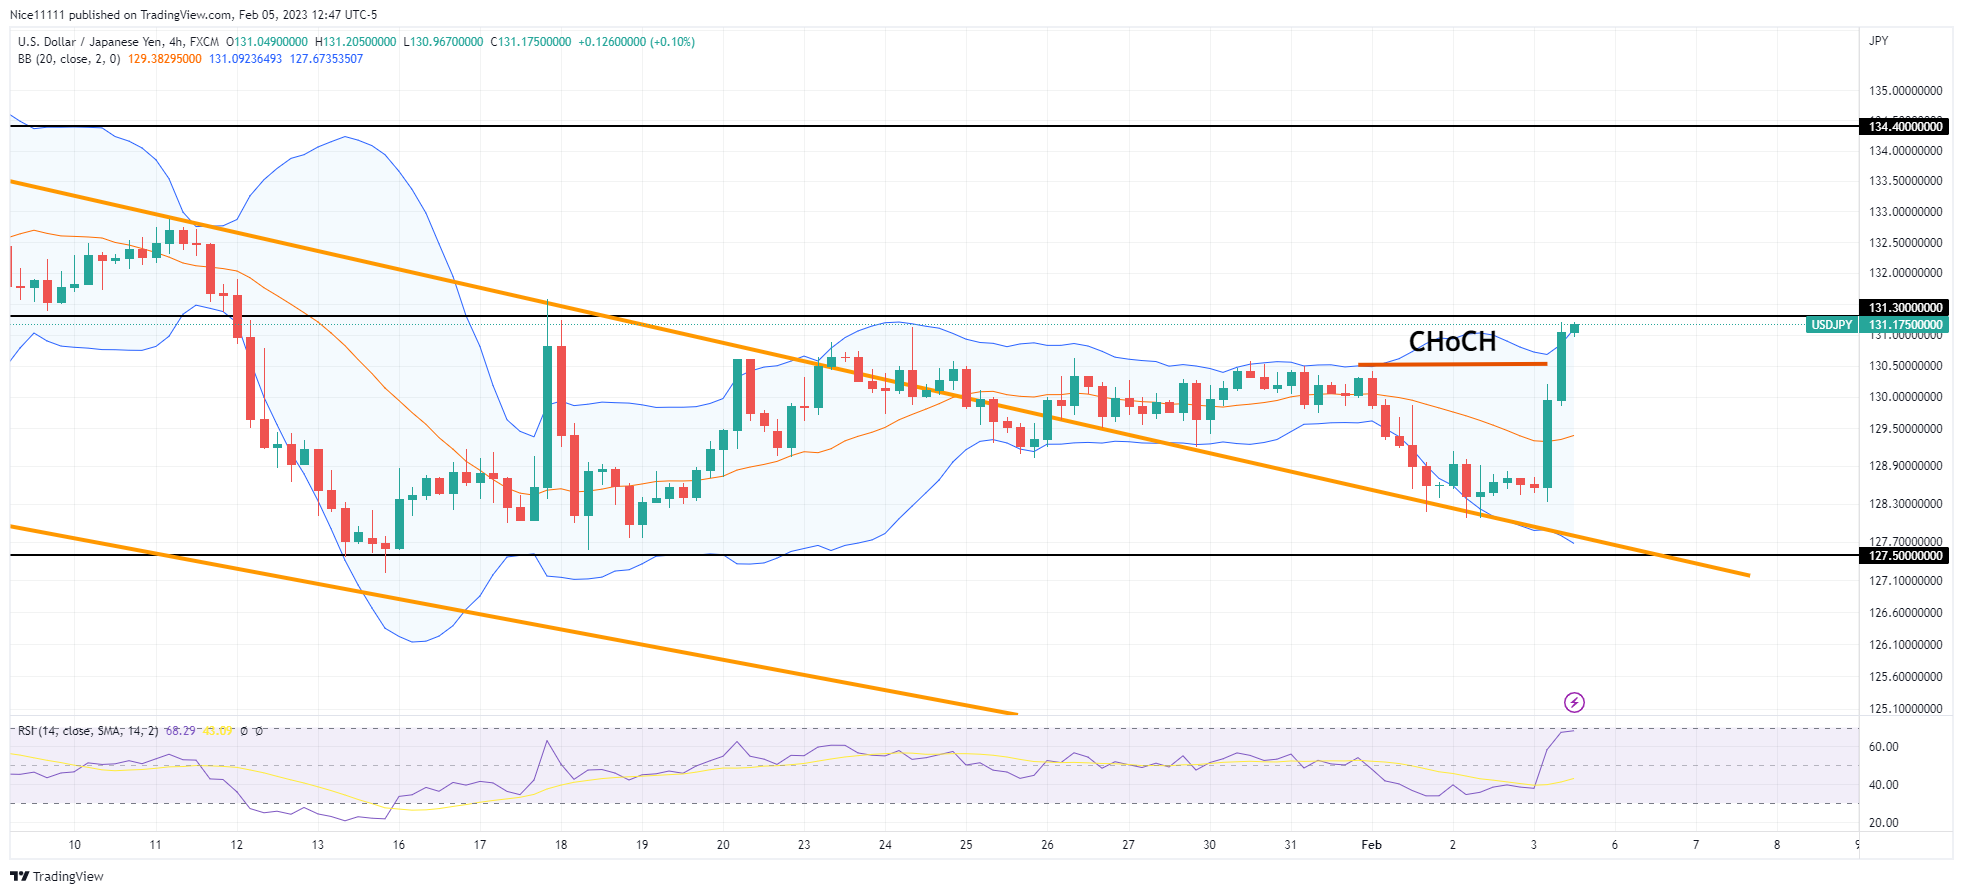
On the four-hour chart, the breakout of the parallel channel is very obvious. The market has launched from the retest of the bearish trendline to aim for higher prices. The market is likely to ascend to 134.40.
Trade on MT4 with Leverage up to 1:500! Trade on MT4 with Leverage up to 1:500!
X
We use cookies to ensure that we give you the best experience on our website. If you continue to use this site we will assume that you are happy with it.