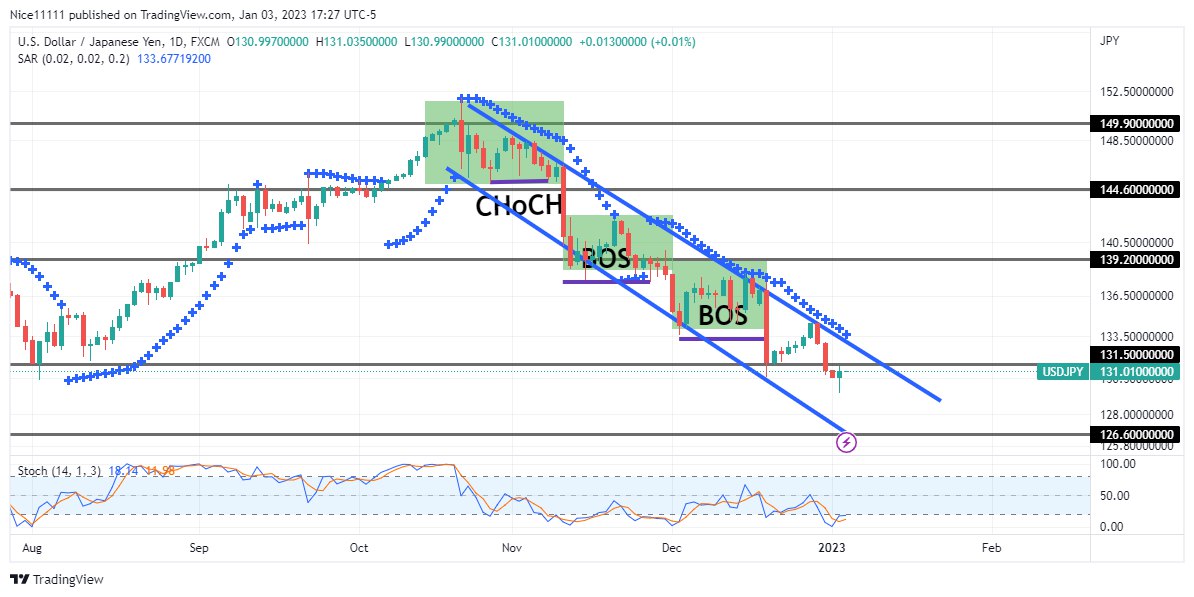
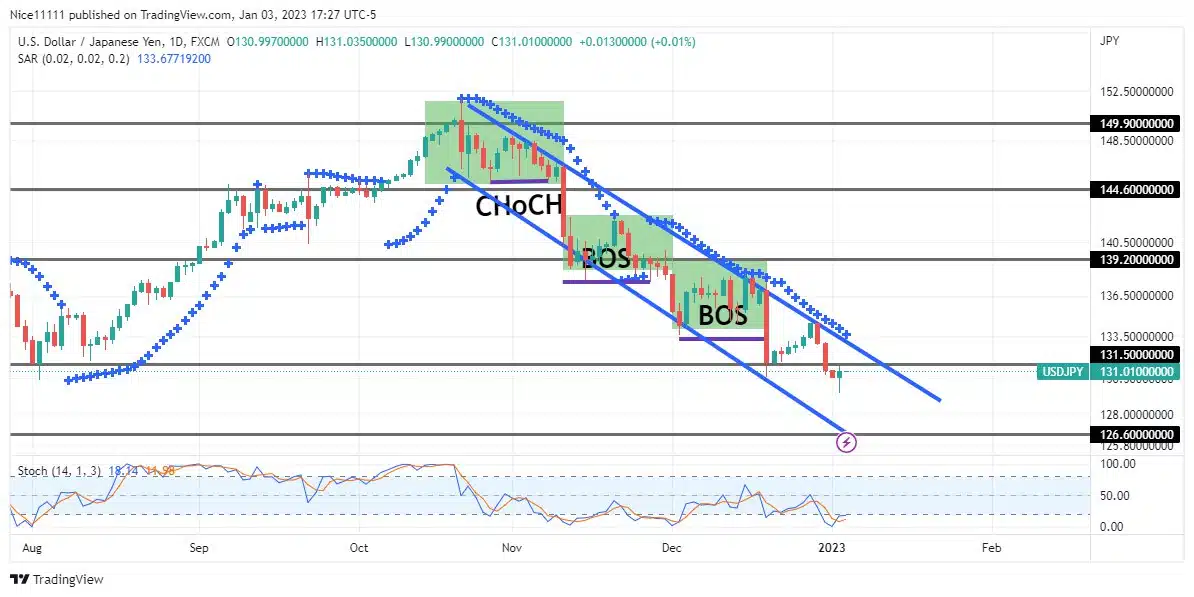
USDJPY – Guide, Tips & Insights | Learn 2 Trade – Guide, Tips & Insights | Learn 2 Trade displays a bearish market structure on the higher (daily) time frame. The market appears to be very bearish.
USDJPY – Guide, Tips & Insights | Learn 2 Trade – Guide, Tips & Insights | Learn 2 Trade is currently delivering the sell-side of the market. The market was bullish from August until mid-October. The uptrend was confirmed by the indication of the Parabolic SAR (Stop and Reverse) indicator. The points of the Parabolic SAR appeared below the daily candles in August. The market was also oversold during the period. Buyers took off from the 131.50 support level. The points of the Parabolic SAR also led the market to a 144.60 supply level without any pause.
During November, the market changed its direction from an uptrend to a downtrend. The Parabolic SAR guided the daily candles away from the resistance level at 149.90 while dominating the candles. After the change of character, multiple BOS (break of structure) have been witnessed. The daily candles are currently assembled in a downward channel.
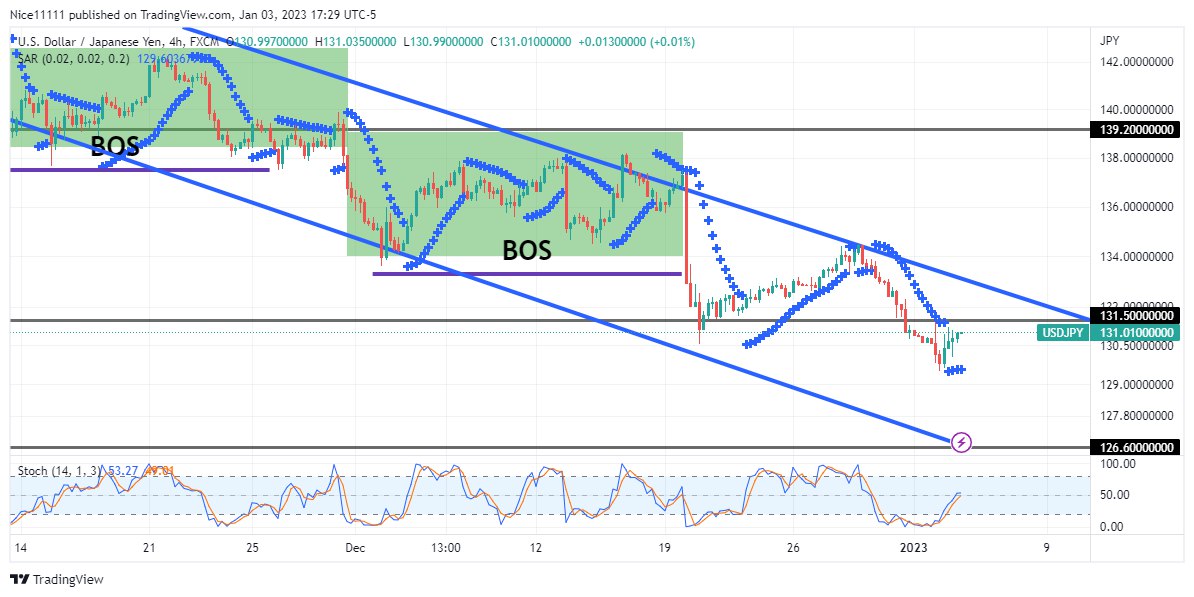
The market seems to have violated the support level at 131.50. The Stochastic is rising from the oversold region, similar to the daily chart. The market is expected to retrace towards 131.50 to deliver another bearish impulsive move.
Trade on MT4 with Leverage up to 1:500! Trade on MT4 with Leverage up to 1:500!
X
We use cookies to ensure that we give you the best experience on our website. If you continue to use this site we will assume that you are happy with it.