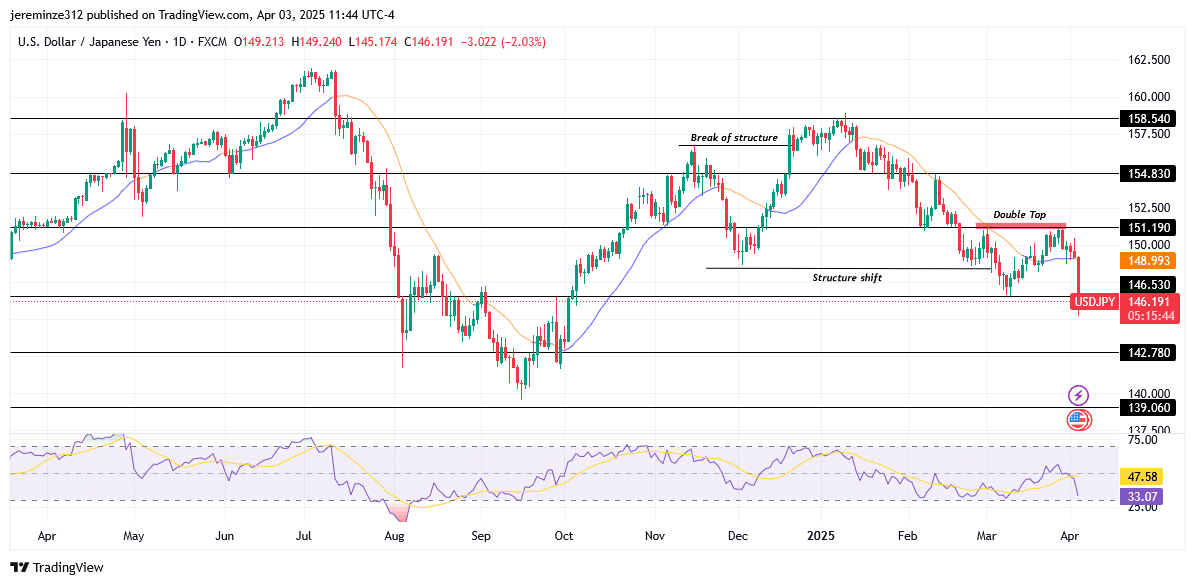
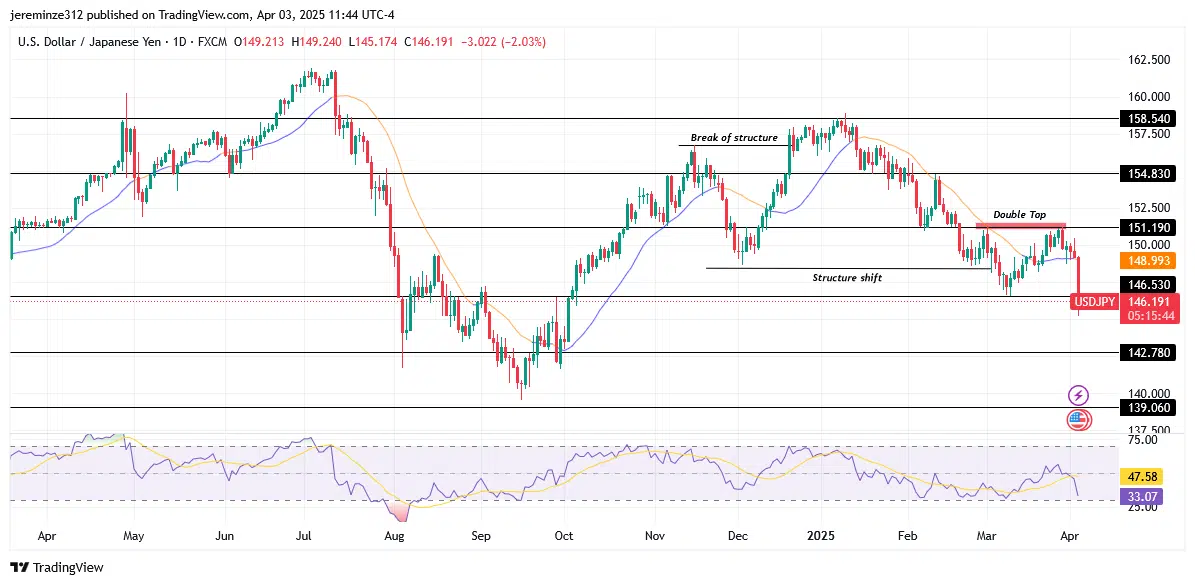
In December 2024, USDJPY – Guide, Tips & Insights | Learn 2 Trade – Guide, Tips & Insights | Learn 2 Trade experienced a significant bullish break of structure, rallying to a high of 158.540. However, this bullish momentum was short-lived, as the market subsequently reversed direction.
Following the Bearish reversal, Price action broke below the key low that initially supported the bullish breakout, signaling a clear shift in market structure and establishing a long-term bearish bias.
Upon descending to the 146.530 demand level, price reacted with a temporary bullish move. This recovery, however, lacked strength and failed to breach the 151.190 resistance level. The inability to surpass this key level led to the formation of a double top—a classic bearish reversal pattern—which reinforced bearish sentiment and triggered an aggressive selloff. Price action eventually breached the 146.530 support slightly, confirming the continuation of the bearish trend.
The daily Moving Average currently indicates a bearish alignment, with price trading below the indicator. This bearish outlook is further supported by weakness observed on the daily Relative Strength Index (RSI). The RSI suggests reduced buying pressure and favoring downward movement.
On the 4-hour timeframe, price recently broke below a previously established bullish trend, initiating the current bearish leg. Presently, price is showing signs of a short-term bullish retracement. This is indicated by the RSI, which is hovering in the overbought region. This suggests a potential exhaustion of the short-term upward move.
Despite this minor retracement, the prevailing trend remains bearish. Price is expected to retrace into the 4-hour Fair Value Gap before resuming its downward trajectory in alignment with the broader bearish market structure.
Trade on MT4 with Leverage up to 1:500! Trade on MT4 with Leverage up to 1:500!
X
We use cookies to ensure that we give you the best experience on our website. If you continue to use this site we will assume that you are happy with it.
 USDJPY – Guide, Tips & Insights | Learn 2 Trade – Guide, Tips & Insights | Learn 2 Trade Short-Term Trend: Bearish
 USDJPY – Guide, Tips & Insights | Learn 2 Trade – Guide, Tips & Insights | Learn 2 Trade Short-Term Trend: Bearish


