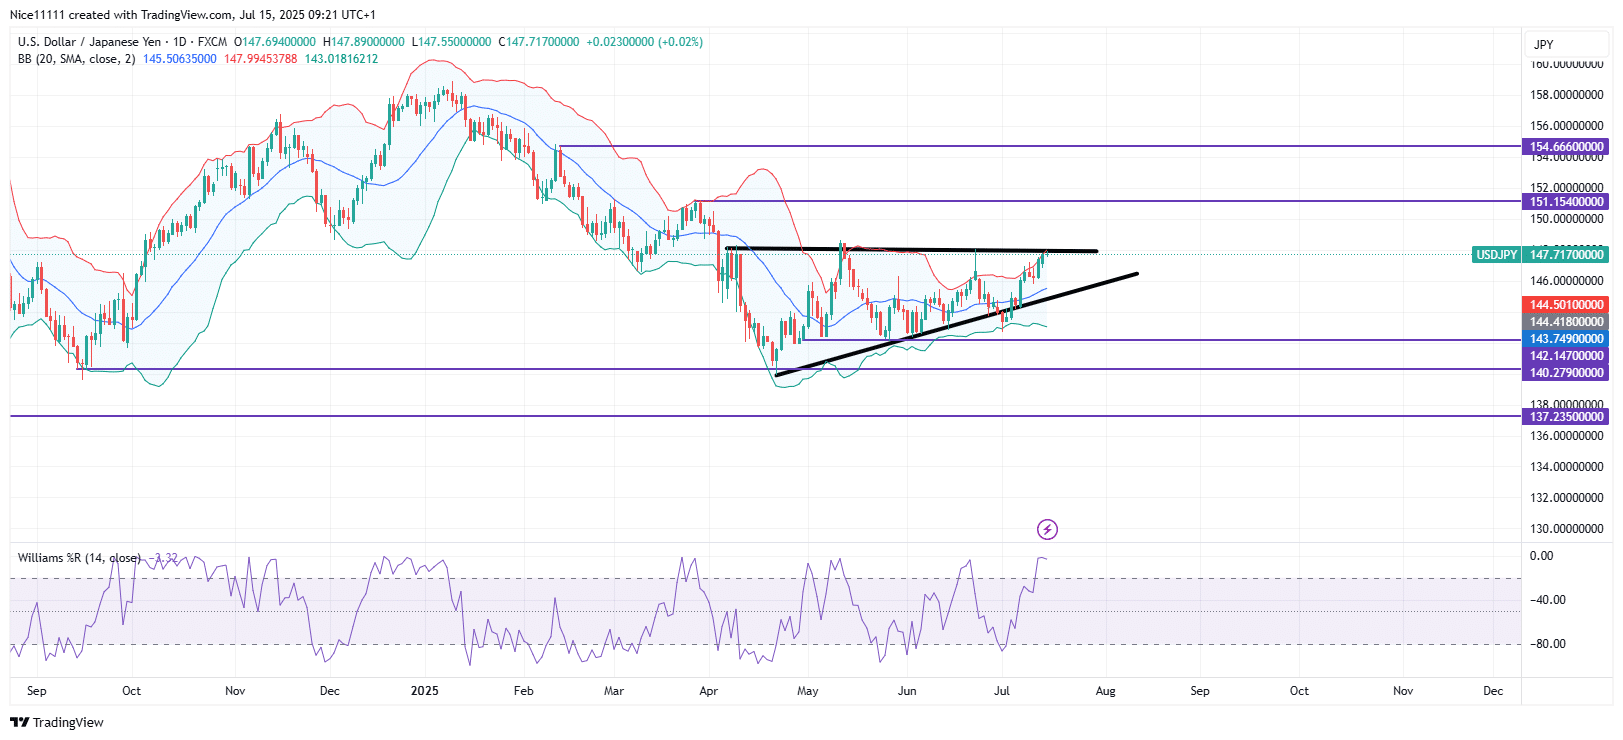
USDJPY – Guide, Tips & Insights | Learn 2 Trade – Guide, Tips & Insights | Learn 2 Trade has returned to the critical resistance level of 147.720 after several failed breakout attempts. Despite the repeated rejections, the presence of higher lows indicates strong buying pressure building up beneath this zone.
Since April, USDJPY – Guide, Tips & Insights | Learn 2 Trade – Guide, Tips & Insights | Learn 2 Trade has struggled to break above the 147.720 level. However, the continuous formation of higher lows has shaped a rising triangle pattern. This structure reflects bullish persistence, with buyers gradually lifting the base of the market with each attempt.
A supporting trendline has developed beneath the price, offering technical reinforcement. At each retest of this trendline, the Williams Percent Range (W%R) has reliably signalled oversold conditions, suggesting strong buying opportunities near the support.
Additionally, the lower Bollinger Band has acted as dynamic support during these retracements. Each touch of the band has sparked a swing low followed by a bounce back toward resistance. Now that price is once again challenging the 147.720 zone, the market structure continues to favour a bullish breakout if the pattern persists.
The lower timeframe reveals short-term up-and-down trends within the broader ascending triangle. These minor swings show tactical buying and profit-taking activity by market participants.
Traders may anticipate a breakout if the price holds above the resistance trendline. Watching for breakouts with volume confirmation patterns and retests on the lower timeframe could offer early entry signals aligned with the broader bullish pressure forming on the higher timeframe.
Trade on MT4 with Leverage up to 1:500! Trade on MT4 with Leverage up to 1:500!
X
We use cookies to ensure that we give you the best experience on our website. If you continue to use this site we will assume that you are happy with it.

 USDJPY – Guide, Tips & Insights | Learn 2 Trade – Guide, Tips & Insights | Learn 2 Trade Short-term Trend: Bullish
 USDJPY – Guide, Tips & Insights | Learn 2 Trade – Guide, Tips & Insights | Learn 2 Trade Short-term Trend: Bullish


