
Market Analysis – December 25
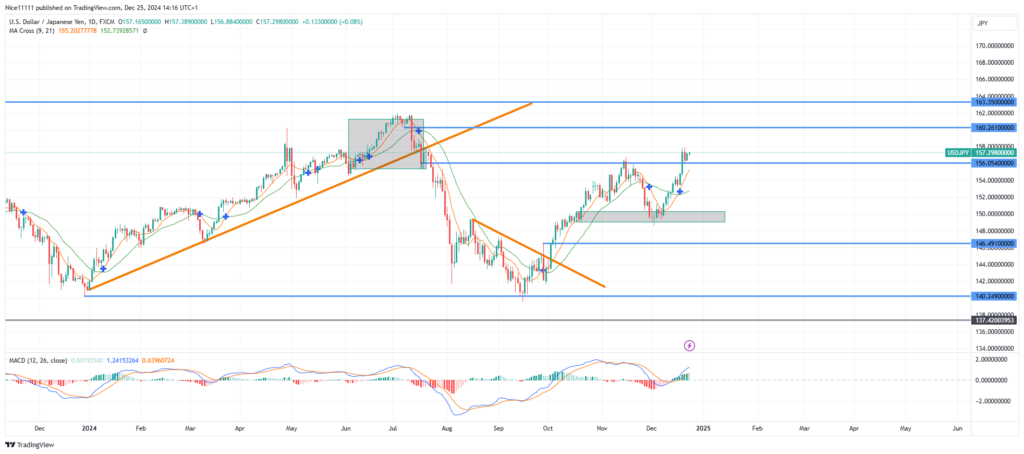
USDJPY – Guide, Tips & Insights | Learn 2 Trade – Guide, Tips & Insights | Learn 2 Trade has regained its bullish momentum after overcoming the key resistance at 156.050, a level that previously halted its upward trend in November. Following a deep retracement, the bulls have reorganized, pushing the price above this critical threshold.
USDJPY – Guide, Tips & Insights | Learn 2 Trade – Guide, Tips & Insights | Learn 2 Trade Key Levels
- Demand Levels: 150.000, 146.490, 140.250
- Supply Levels: 156.050, 160.260, 163.350
 USDJPY – Guide, Tips & Insights | Learn 2 Trade – Guide, Tips & Insights | Learn 2 Trade Long-Term Trend: Bullish
In November, USDJPY – Guide, Tips & Insights | Learn 2 Trade – Guide, Tips & Insights | Learn 2 Trade tested the resistance at 156.050, which triggered the formation of a head and shoulders pattern, signalling a potential reversal. During this phase, the 9-period Moving Average crossed below the 21-period Moving Average, confirming a short-term descent.
The price retraced to a bullish order block situated near the psychological level of 150.000, where buyers re-entered the market. This recovery gained momentum as the price moved above the Moving Averages. Simultaneously, the MACD displayed green histogram bars, reinforcing the bullish outlook.
 USDJPY – Guide, Tips & Insights | Learn 2 Trade – Guide, Tips & Insights | Learn 2 Trade Short-Term Trend: Bullish
The recent rally successfully broke the 156.050 resistance level, affirming the long-term bullish structure. On the daily chart, a bullish order block now resides below this resistance, which could act as a support zone if the price pulls back.
Traders should monitor for a potential structural shift on lower timeframes during a pullback. This could provide a high-risk-to-reward opportunity for forex signals to capitalize on further bullish momentum. Such setups may offer optimal conditions for identifying profitable long positions.
Make money without lifting your fingers: Start using a world-class auto trading solution
- Broker
- Min Deposit
- Score
- Visit Broker

- Award-winning Cryptocurrency trading platform
- $100 minimum deposit,
- FCA & Cysec regulated

- 20% welcome bonus of upto $10,000
- Minimum deposit $100
- Verify your account before the bonus is credited


- Fund Moneta Markets account with a minimum of $250
- Opt in using the form to claim your 50% deposit bonus


