

USDCHF Price Analysis – April 15
When the resistance level of $0.9436 holds, bearish momentum may increase, USDCHF price may break down the support level at $0.9392, then, 0.9355 levels may be reached and it may decline to $0.9318 level. Should the bulls break up the resistance level of $0.9436, the price may increase towards $0.9471, and $0.9490 levels.
USDCHF Market
Key Levels:
Resistance levels: $0.9436, $0.9471, $0.9490
Support levels: $0.9392, $0.9355, $0.9318
USDCHF Long-term trend: Bullish
USDCHF is bullish on the long-term outlook. The currency pair was trading within the descending channel few days ago. There was a bullish breakout at the $0.9271 and price increases towards the resistance level of $0.9436. The former resistance level of $0.9355 and $0.9392 have turned to support levels. The price is currently pulling back.
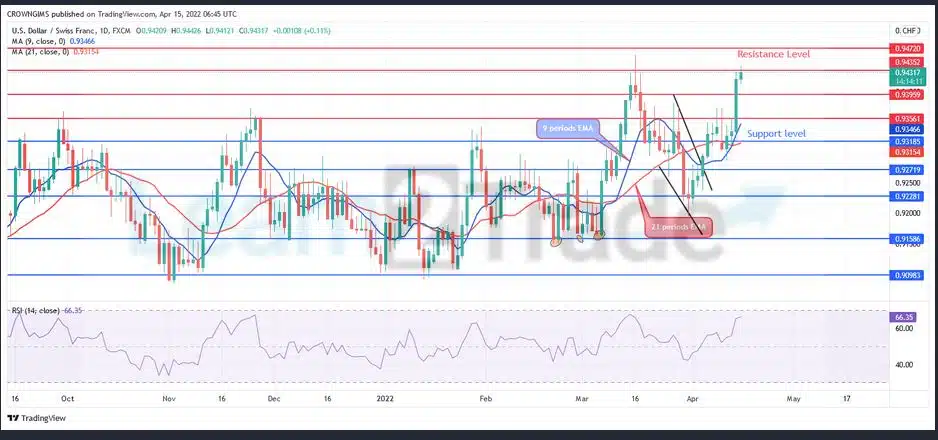
USDCHF is trading above the two EMAs at a distance. The 9 periods EMA has crossed the 21 periods EMA upside. The Relative Strength Index period 14 is at 64 levels bending up to indicate bullish market direction. When the resistance level of $0.9436 holds, bearish momentum may increase, USDCHF price may break down the support level at $0.9392, then, 0.9355 levels may be reached and it may decline to $0.9318 level. Should the bulls break up the resistance level of $0.9436, the price may increase towards $0.9471, and $0.9490 levels.
USDCHF Medium-term Trend: Bullish
USDCHF is bullish in the medium-term outlook. After the breakout from the descending channel formed by the price action last week on the 4-hour chart, the price increases and reached resistance level of $0.9436. The bulls’ momentum failed. The price started a consolidation movement at the resistance level of $0.9436 level.

The 9 period EMA remains above the 21 periods EMA as a sign of bullish market. USDCHF is trading above the two EMAs. Meanwhile, the Relative Strength Index period 14 is at 64 levels with signal line pointing down to indicate sell signal.


