Bearish momentum increases in USDCHF market
USDCHF Price Analysis – 22 December
USDCHF may rise past the $0.88 resistance level and toward the $0.89 barrier level if the purchasing momentum can break over the $0.86 resistance level. Sellers may be able to push the price through the $0.85 barrier and into the $0.84 and $0.83 zones if they exert sufficient pressure.
USDCHF Market
Key Levels:
Resistance levels: $0.86, $0.88, $0.89
Support levels: $0.85, $0.84, $0.83
USDCHF Long-term trend: Bearish
The USDCHF daily chart is trending downward. The declining USDCHF market was controlled by sellers. Not quite as much as $0.89 is involved. Since October 24, sellers have been controlling the USDCHF market. The currency pair’s price surged over the $0.90 support level. A bearish engulfing candle pattern appeared on November 1, close to the $0.90 resistance level, indicating the start of a drop. Eventually, the price found support at $0.86, and it is currently declining and putting significant pressure on the $0.85 level.
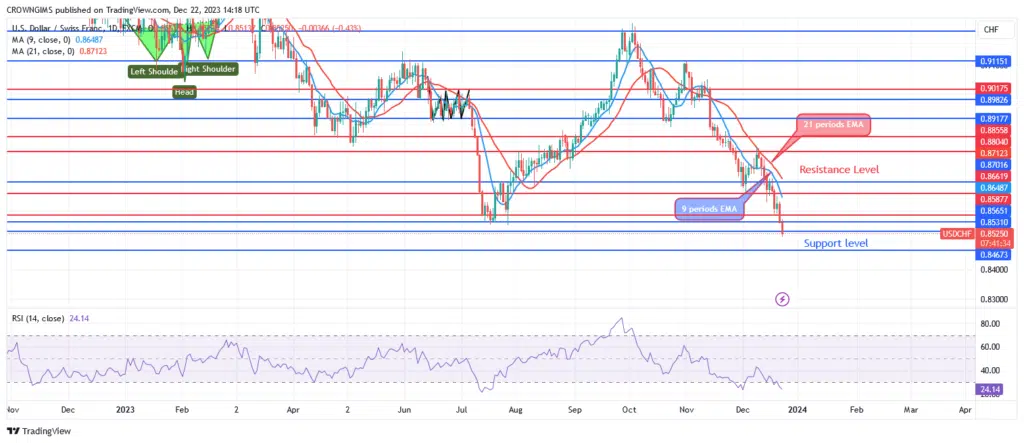
The current USD/CHF exchange rate is below both the 9- and 21-period moving averages, suggesting that sellers are gaining strength. A bearish market is indicated by the Relative Strength Index period 14 at 24 levels. The price may rise past the $0.88 resistance level and toward the $0.89 barrier level if the purchasing momentum can break over the $0.86 resistance level. Sellers may be able to push the price through the $0.85 barrier and into the $0.84 and $0.83 zones if they exert sufficient pressure.
USDCHF Medium-term Trend: Bearish
Trends over the medium term show that the USDCHF is declining. The currency pair began to decline on October 4 when a double top chart pattern appeared close to the $0.92 resistance level. The price fell on December 3 and stabilized at $0.86. A bearish daily bar formed, and the price moved downward to break through the $0.85 support level at the present.
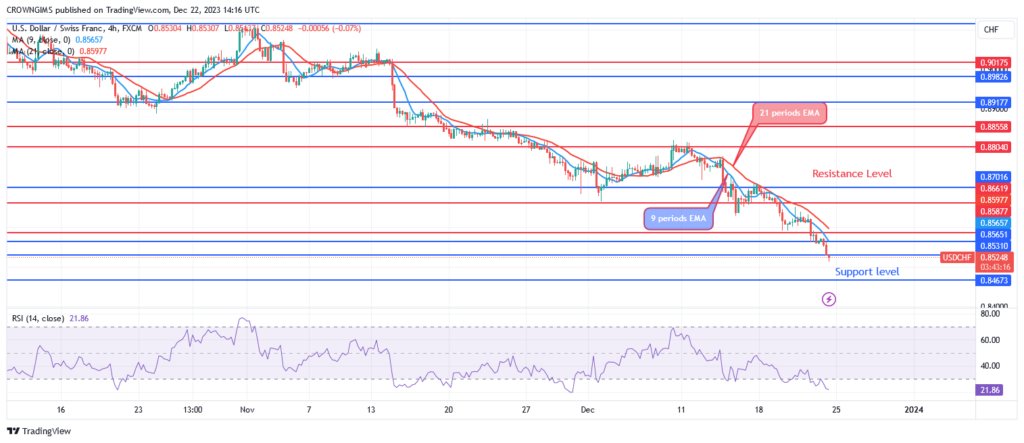
The currency pair’s trading below both the 9- and 21-period exponential moving averages indicates a bearish market. The Relative Strength Index’s period 14 signal line suggests selling when the index hits the 22 level.
You can purchase Lucky Block – Guide, Tips & Insights | Learn 2 Trade here. Buy LBLOCK
- Broker
- Min Deposit
- Score
- Visit Broker

- Award-winning Cryptocurrency trading platform
- $100 minimum deposit,
- FCA & Cysec regulated

- 20% welcome bonus of upto $10,000
- Minimum deposit $100
- Verify your account before the bonus is credited
- Fund Moneta Markets account with a minimum of $250
- Opt in using the form to claim your 50% deposit bonus
Learn to Trade
Never Miss A Trade Again

Signal Notification
Real-time signal notifications whenever a signal is opened, closes or Updated

Get Alerts
Immediate alerts to your email and mobile phone.

Entry Price Levels
Entry price level for every signal Just choose one of our Top Brokers in the list above to get all this free.