Bulls are dominating USDCHF market
USDCHF Price Analysis – 17 February
In case buyers maintain their pressure and hold the $0.92 support level, USDCHF may break through the $0.93 resistance level and rise toward the $0.94 and $0.95 resistance levels. The $0.92 barrier level may be broken if the sellers apply more pressure, and the bearish trend may continue to the $0.91 and $0.90 levels
USDCHF Market
Key Levels:
Resistance levels: $0.93, $0.94, $0.95
Support levels: $0.92, $0.91, $0.90
USDCHF Long-term trend: Bearish
USDCHF is on a bullish movement on the Long-term outlook. It is clearly seen on the daily chart, the formation of an inverted head and shoulder pattern. Last week, the price dropped through the prior support levels of $0.93 and $0.92 as the selling momentum grew. When the price attempted to drop under the $0.90 support, buyers were able to oppose sellers and move the price past the $0.92 resistance level. The USDCHF market is likely to be dominated by buyers next week.
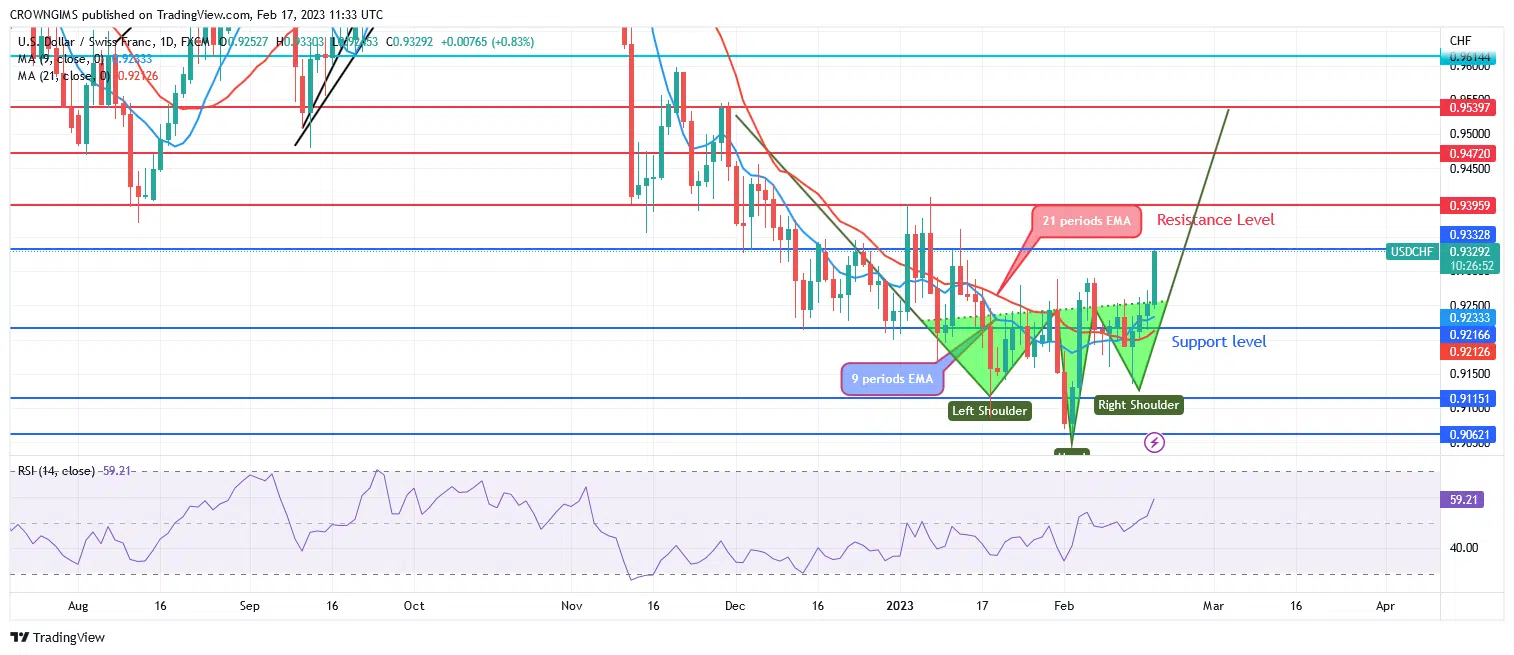
USDCHF is trading above the two EMAs and the 9-period EMA crossing 21-period EMAs upwards. The Relative Strength Index period 14 at 59 levels shows a positive market trend. In case buyers maintain their pressure and hold the $0.92 support level, the price may break through the $0.93 resistance level and rise toward the $0.94 and $0.95 resistance levels. The $0.92 barrier level may be broken if the sellers apply more pressure, and the bearish trend may continue to the $0.91 and $0.90 levels.
USDCHF Medium-term Trend: Bullish
USDCHF is bullish in the medium-term outlook. The formation of an inverted head and shoulder chart pattern triggers a bullish trend in the USDCHF market. Three weeks ago, sellers stopped purchasers, causing the price to fall until it reached the support level of $0.90 on February 1st when the price was climbing near the $0.93 resistance level. The bulls were able to take over the USDCHF market. Currently, it is pressing hard on $0.93 resistance level.
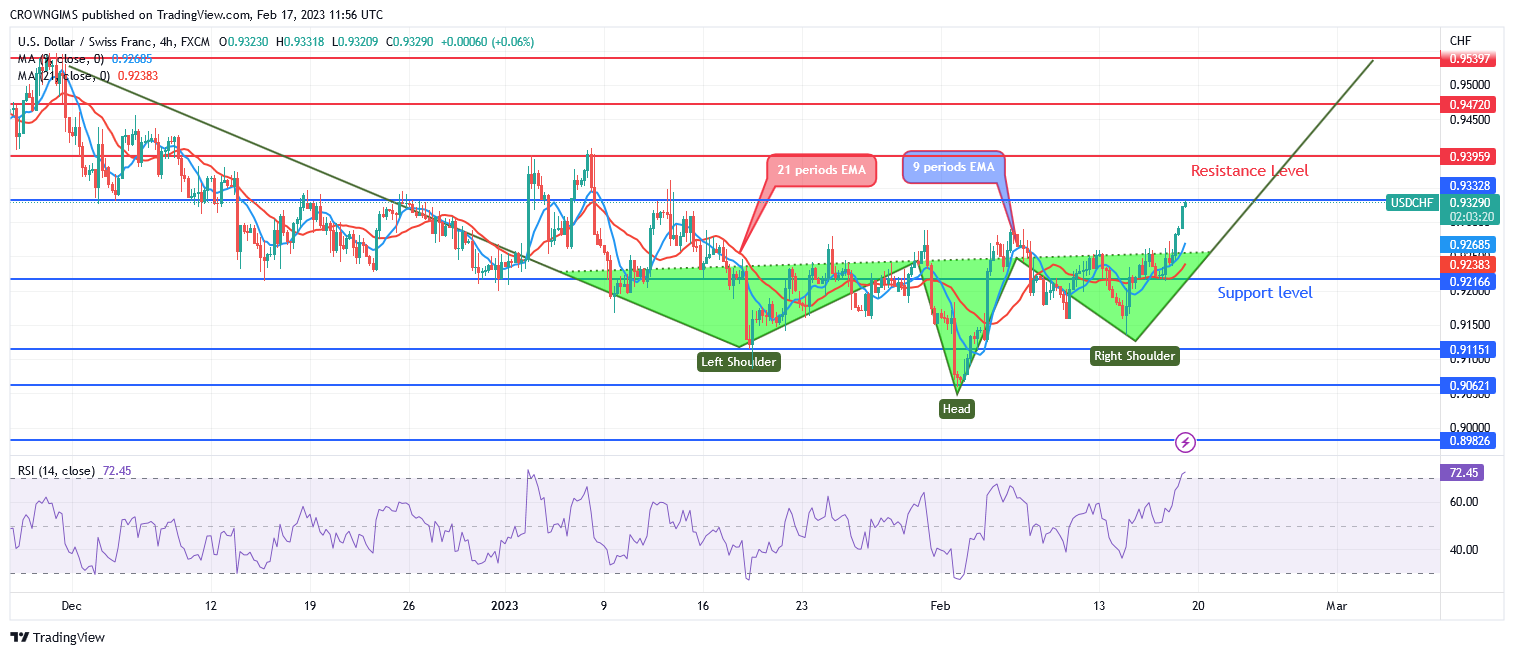
The 9-period EMA is above the 21-period EMA. The USDCHF is currently trading above the two EMAs, indicating bullish momentum. The signal line on the Relative Strength Index period 14 is displaying a bullish direction at the 72 levels.
You can purchase crypto coins here: Buy LBLOCK
- Broker
- Min Deposit
- Score
- Visit Broker

- Award-winning Cryptocurrency trading platform
- $100 minimum deposit,
- FCA & Cysec regulated

- 20% welcome bonus of upto $10,000
- Minimum deposit $100
- Verify your account before the bonus is credited
- Fund Moneta Markets account with a minimum of $250
- Opt in using the form to claim your 50% deposit bonus
Learn to Trade
Never Miss A Trade Again

Signal Notification
Real-time signal notifications whenever a signal is opened, closes or Updated

Get Alerts
Immediate alerts to your email and mobile phone.

Entry Price Levels
Entry price level for every signal Just choose one of our Top Brokers in the list above to get all this free.