Bullish trend may commence in USDCHF market
USDCHF Price Analysis – 01 December
If the buying momentum is able to break above the $0.88 resistance level, USDCHF can move past the $0.89 resistance level and toward the $0.90 barrier levels. If sellers apply enough pressure, they might be able to move the price past the $0.87 barrier and into the $0.86 and $0.85 zones.
USDCHF Market
Key Levels:
Resistance levels: $0.88, $0.89, $0.90
Support levels: $0.87, $0.86, $0.85
USDCHF Long-term trend: Bearish
There is a bearish trend on the USDCHF daily chart. Sellers are currently in charge of the USDCHF market, and it is falling. It is well below the $0.90 mark. Since October 24, Sellers dominated the USDCHF market. The price of the currency pair began to fall after breached the support level of $0.90. On November 1, near the $0.90 resistance level, a strong bearish engulfing candle pattern emerged, signaling the beginning of a downward trend. The price is currently exposed to $0.87 and has broken below the $0.88 support level.
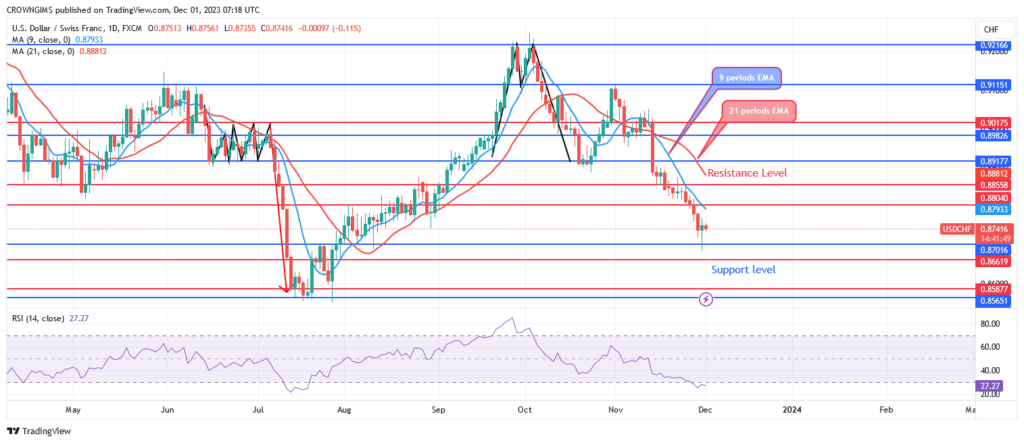
Given that the current USD/CHF exchange rate is below the 21- and 9-period moving averages, it appears that the vendors’ momentum is increasing. The Relative Strength Index period 14 at 32 levels indicates a bearish market. If the buying momentum can break above the $0.88 resistance level, the price can move past the $0.89 resistance level and toward the $0.90 barrier levels. If sellers apply enough pressure, they might be able to move the price past the $0.87 barrier and into the $0.86 and $0.85 zones.
USDCHF Medium-term Trend: Bearish
The medium-term trend shows a decline in USDCHF. The beginning of the currency pair’s declining trend was indicated on October 4 by the appearance of a double-top chart pattern close to the $0.92 resistance level. Bearish candles are a good way to gauge the market. The $0.89 support level was tested on October 24. It fell to $0.90 once more. Since sellers are in charge, the $0.88 support level is currently being tested.

A bearish market is indicated by the currency pair’s trading below both the 9- and 21-period exponential moving averages. The Relative Strength Index’s period 14 signal line indicates a buy when the index reaches 37.
You can purchase Lucky Block – Guide, Tips & Insights | Learn 2 Trade here. Buy LBLOCK
- Broker
- Min Deposit
- Score
- Visit Broker

- Award-winning Cryptocurrency trading platform
- $100 minimum deposit,
- FCA & Cysec regulated

- 20% welcome bonus of upto $10,000
- Minimum deposit $100
- Verify your account before the bonus is credited
- Fund Moneta Markets account with a minimum of $250
- Opt in using the form to claim your 50% deposit bonus
Learn to Trade
Never Miss A Trade Again

Signal Notification
Real-time signal notifications whenever a signal is opened, closes or Updated

Get Alerts
Immediate alerts to your email and mobile phone.

Entry Price Levels
Entry price level for every signal Just choose one of our Top Brokers in the list above to get all this free.