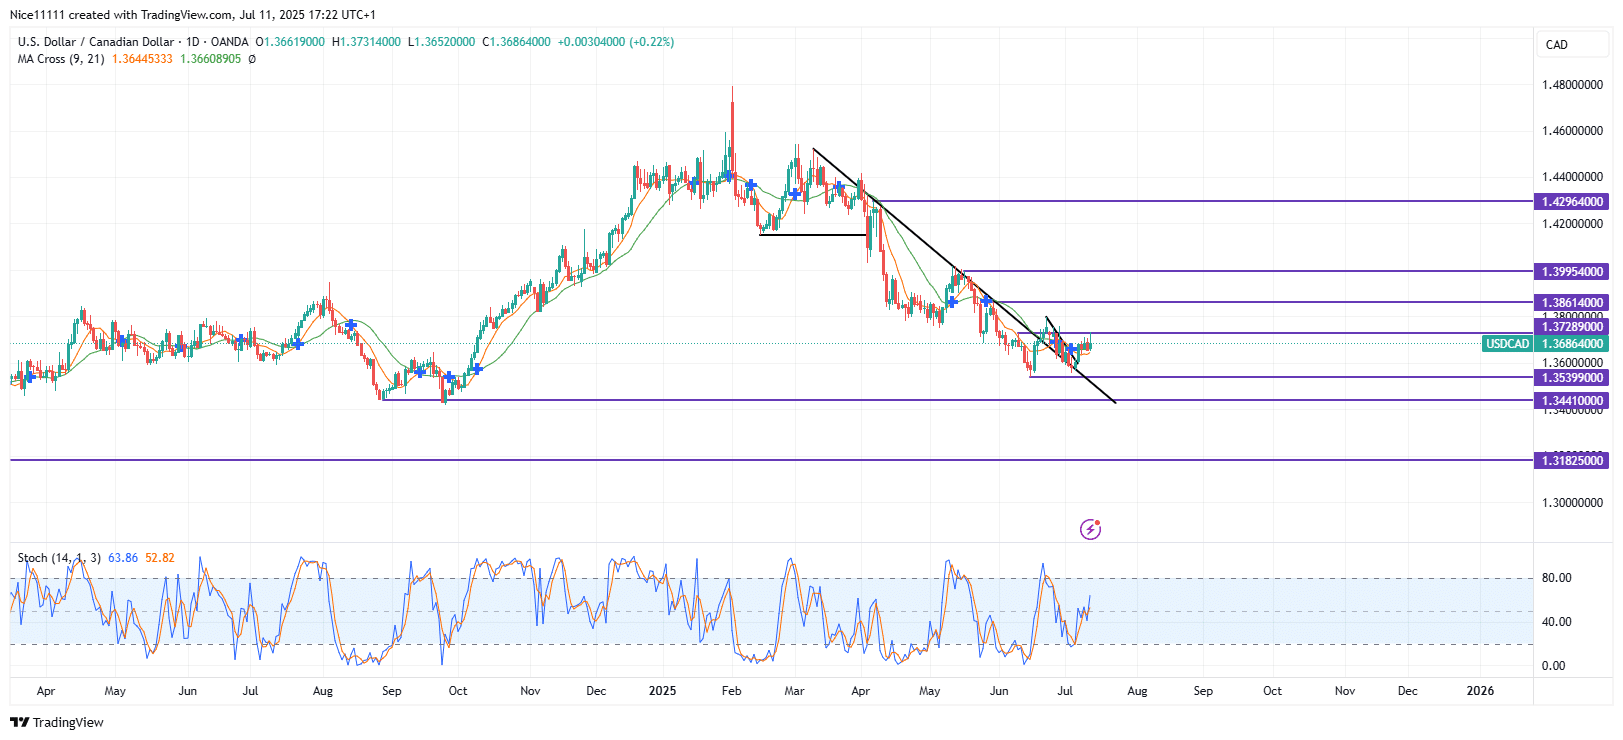
A resistance trendline has guided USDCAD since March. In June, the price broke decisively above this trendline, signaling a potential shift in market sentiment from bearish to bullish. After the breakout, the price retested the broken trendline, forming a continuation pattern. Now, the pair appears ready to extend its upward move.
In April, USDCAD established a strong downtrend after a sharp decline below the February swing low at 1.41510. The price then retraced into a bearish order block, triggering a steep sell-off characterized by large bearish candles. This move highlighted strong selling pressure and heightened volatility.
However, the downtrend found firm support at 1.35400, where a failure swing formed a double bottom—a key reversal pattern. This structure propelled an upward surge, allowing the price to break above the resistance trendline that had previously capped gains. With the Moving Averages now below the current price, the breakout gains further confirmation, supporting continued bullish momentum.
USDCAD Short-Term Trend: Bullish
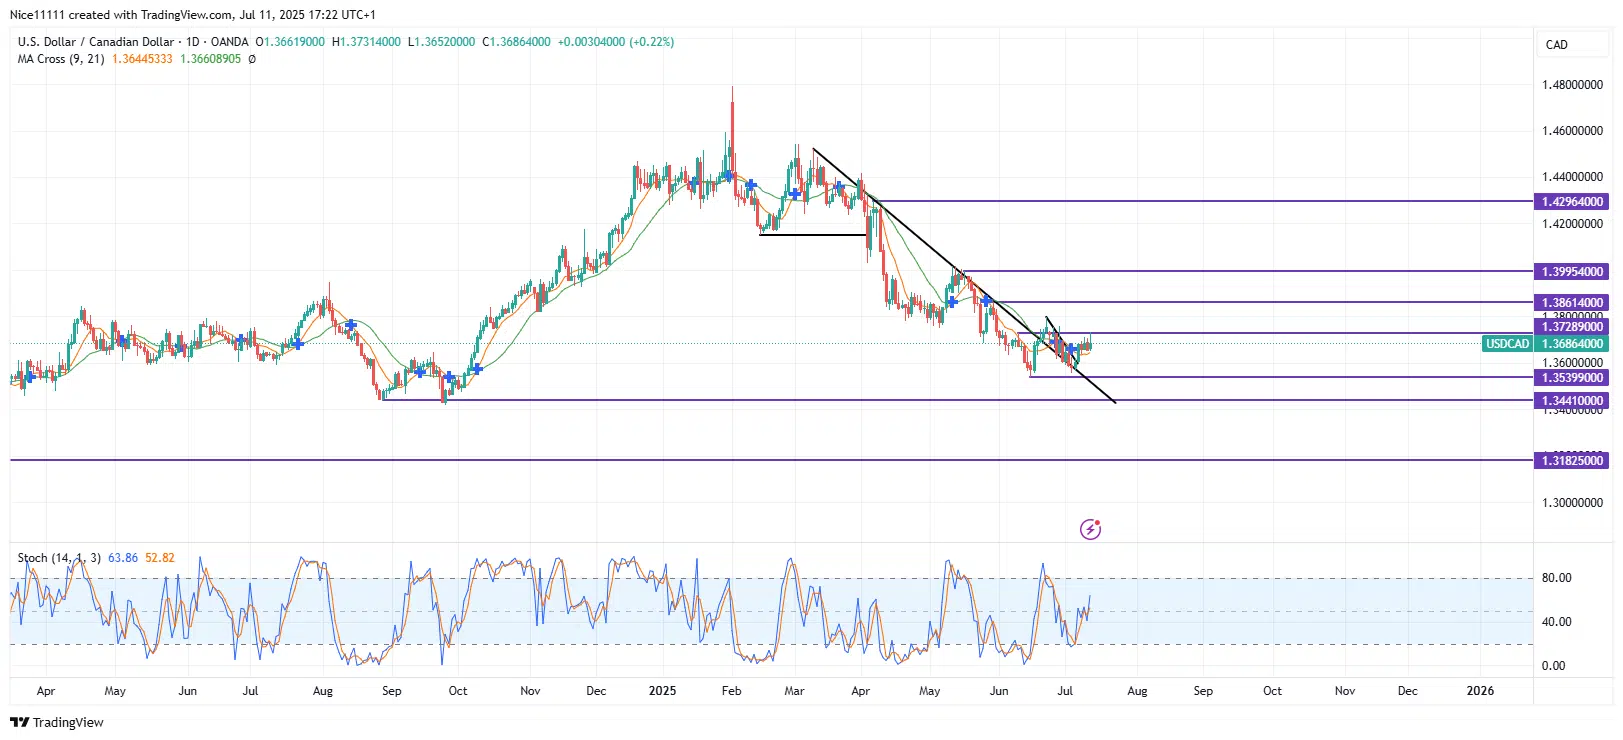
On the lower timeframe, the retest of the broken resistance trendline took the shape of a bearish wedge. The price has since broken out of this wedge, rallying to 1.37290. A strong close above this level would be used to generate bullish forex signals, targeting the next key swing high at 1.38610 and reinforcing the upward trend.
Trade on MT4 with Leverage up to 1:500! Trade on MT4 with Leverage up to 1:500!
X
We use cookies to ensure that we give you the best experience on our website. If you continue to use this site we will assume that you are happy with it.
 USDCAD Short-Term Trend: Bullish
 USDCAD Short-Term Trend: Bullish


