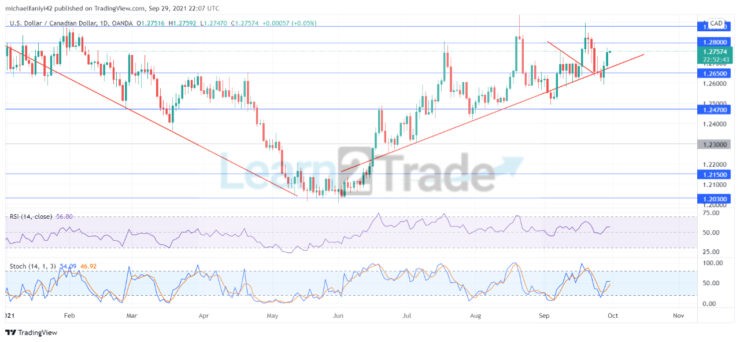
USDCAD remains on an upward trajectory as it keeps bouncing off an uptrend line. This upward trajectory has enabled the market to systematically and continuously break through the resistance levels it encounters. The market is therefore seen displaying consistent higher highs and higher lows. However, the market was blocked from making a higher high the last time by the 1.28800 resistance level, but the price still made a higher low.
USDCAD Key Levels
Resistance Levels: 1.28000, 1.28800, 1.30330 Support Levels: 1.26500, 1.24700, 1.23000
USDCAD Long Term Trend: Bullish
The coin began an uptrend after it disembarked from a downtrend at the 1.20300 support. USDCAD ranged for a while with 1.21500 as the resistance. After a while, price broke out and surged up to 1.24700, after which it made a retracement to 1.23000. From this support, price then made its way up gradually above the 1.24700 price level. USDCAD keeps repeating this pattern to remain in its upward trajectory.
USDCAD has, through this means, been able to climb up to 1.26500, from which it now faces a sterner test at the 1.28800 resistance level. The resistance level remains firm in preventing the upward movement above it, but the coin keeps making higher lows. Momentum remains with the bulls, as can be seen on the Relative Strength Index, which shows its signal line predominantly above the middle line. The market has currently bounced up from the trendline and the Stochastic Oscillator also shows upward crossed lines.
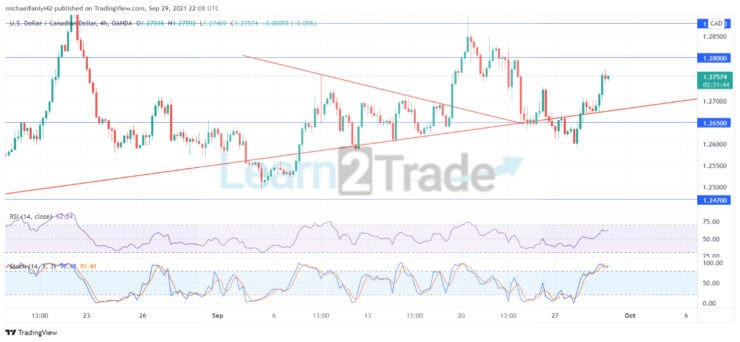
USDCAD Short Term Trend: Bullish
The coin is on its way upward again to confront the 1.28800 resistance, but before that, it must first violate the 1.28000 level. The Stochastic Oscillator on the 4-hour chart has its lines climbing deep into the overbought region. There is now a cross of the lines, which means that a short period of retracement is likely to happen. The RSI indicator shows the market remains bullish even on the 4-hour chart.
The market will complete its cycle by reaching up to 1.28800 and will look to break further to continue its uptrend.
Note:Cryptosignals.org is not a financial advisor. Do your research before investing your funds in any financial asset or presented product or event. We are not responsible for your investing results.
Trade on MT4 with Leverage up to 1:500! Trade on MT4 with Leverage up to 1:500!
X
We use cookies to ensure that we give you the best experience on our website. If you continue to use this site we will assume that you are happy with it.