

Market Analysis – November 6
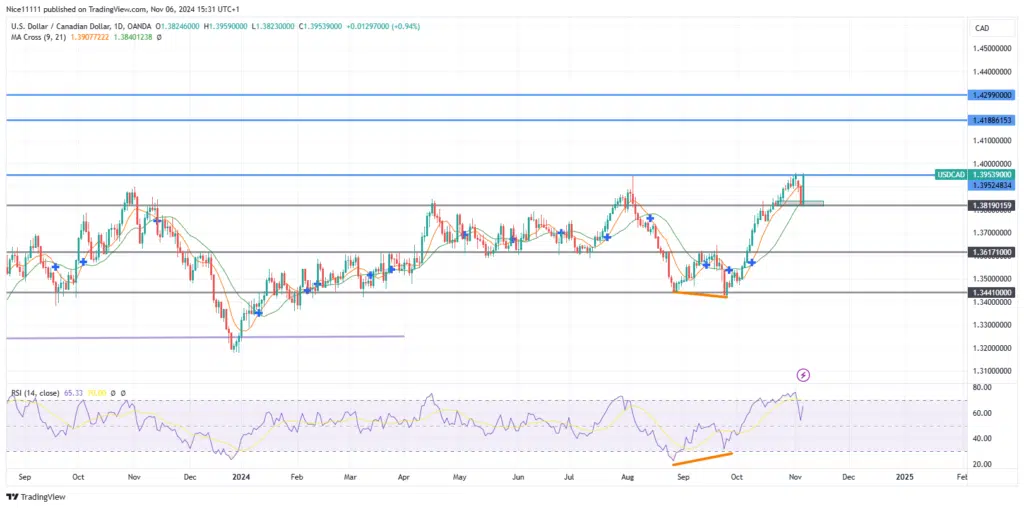
The USDCAD market encountered resistance for the second time this year upon reaching the supply zone at 1.39520. Following a pullback to the key level of 1.38190, USDCAD quickly recovered and is now making another attempt to break through this supply zone.
USDCAD Key Levels
Demand Levels: 1.38190, 1.36170, 1.34410
Supply Levels: 1.38520, 1.41890, 1.42990
USDCAD Long-Term Trend: Bullish
The formation of a double bottom pattern in October near the demand level of 1.34410 signalled a bullish reversal. Although price action dipped lower at this level, the Relative Strength Index (RSI) displayed a higher low in the oversold region, indicating increased buying strength and potential for upward movement.
.
Once the price broke above the prior resistance level of 1.36170, a bullish crossover occurred with the nine-period Moving Average crossing above the 21-period Moving Average, confirming a bullish trend. At the supply level of 1.3952, the price briefly fell below the nine-period Moving Average, indicating a minor retracement; however, it remained above the 21-period Moving Average, reaffirming the underlying bullish market sentiment.
 USDCAD Short-Term Trend: Bullish
.
Make money without lifting your fingers: Start using a world-class auto trading solution


