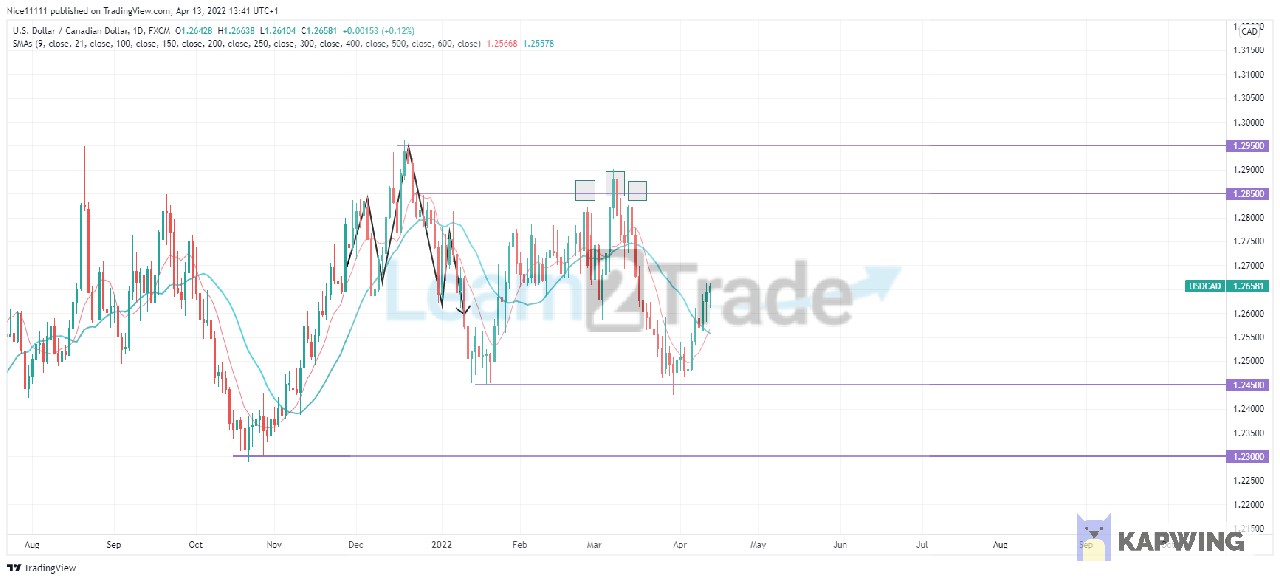
USDCAD has resumed a bullish run after its last bullish run for the previous year ended in November. This occurred after the distribution in the market that led to the demand zone at $1.2300. The dollar increased in value as the buying pressure increased at the demand zone. The Moving Averages crossed early enough to confirm to go long. The market surged to reach 1.2950.
The market formed a head and shoulder pattern beneath the supply level pattern. The new bearish run was hindered at 1.2450. The market found supply. This helped the bulls resume their bullish run. A triple top pattern was formed at 1.2850. This revealed that the bulls experienced difficulty reaching higher prices in the market.
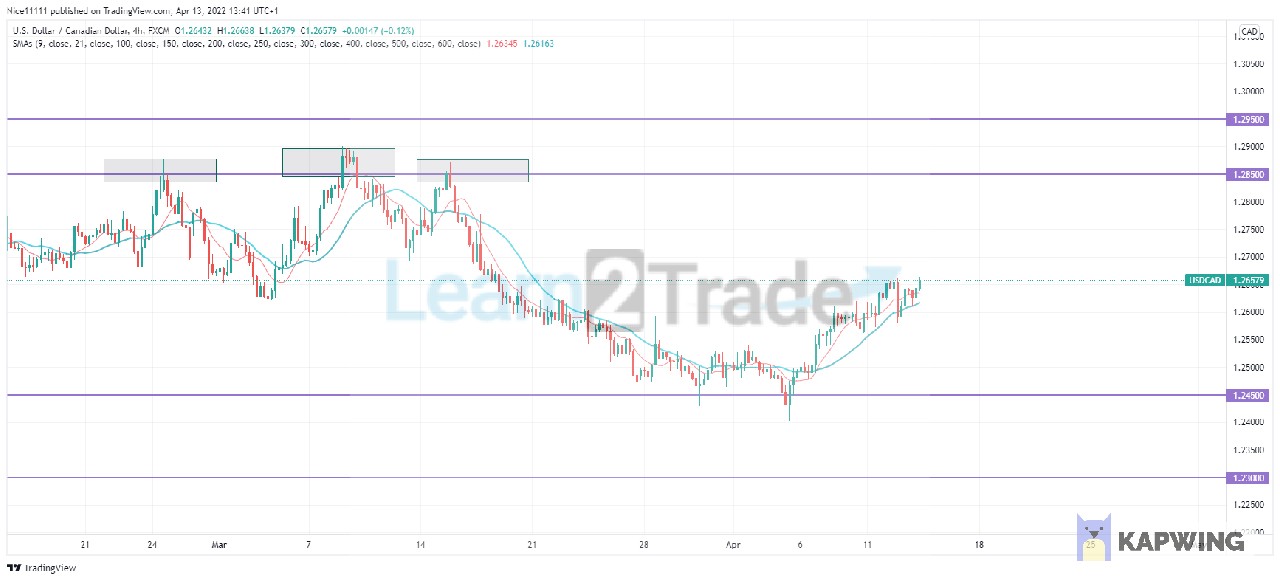
There was a structural market shift on the 16th of March. The market resumed the bearish phase after several weeks of consolidation. The demand zone at 1.2450 was tested for the second time. There were spikes beneath the demand zone. The false breakout occurred on the 30th of March and the 5th of April. The market has resumed its bullish run after the second false breakout.
USDCAD Short Term Trend: Bullish
The Moving Average has switched positions to signify that the market has initiated a new trend. The daily high on the 1st of April has been cleared to show a market direction change. USDCAD has resumed a bullish run to aim for the supply level at $1.2850.
Note:Learn2.trade is not a financial advisor. Do your research before investing your funds in any financial asset or presented product or event. We are not responsible for your investing results.
Trade on MT4 with Leverage up to 1:500! Trade on MT4 with Leverage up to 1:500!
X
We use cookies to ensure that we give you the best experience on our website. If you continue to use this site we will assume that you are happy with it.