USDCAD Analysis – Price Follows a Strong Bullish Moment Despite Bears’ Restraint at the 1.25900 Influence of Price
USDCAD follows a strong bullish moment despite bear restraints at the 1.25900 level of significance. The market is set in a forward direction and price movement will thus follow suit. The bulls, therefore, encourage price movement to flow more in the positive direction following an increase in the vigor of price movement. The bears’ strength is at a very low diminishing point, and this gives the bulls the upper hand to assume price direction going forward.
USDCAD Price Levels:
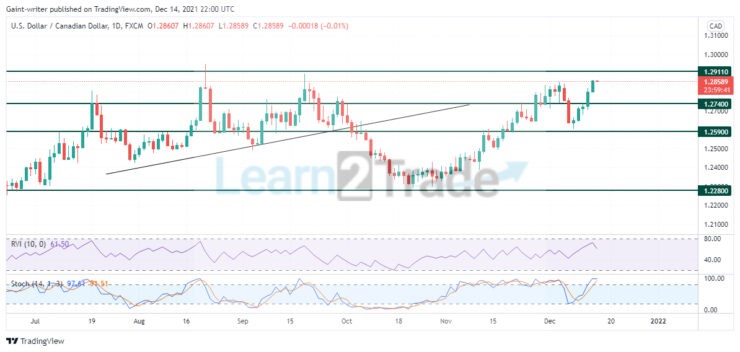
Resistance Levels: 1.29110, 1.27400 Support Levels: 1.25900, 1.22800
USDCAD Long Term Trend: Bullish
USDCAD natural market state follows the uptrend price pattern. The market is seen to assume a bullish direction and prices continue to vary upward right from early July. The movement of the bulls continued from July, and the bulls took the price on an upswing. The price rose above new levels, following a trend line channel. The longer the retest is held at this line, the more the bulls are willing to hold the market based on their terms. After the upswing forward, USDCAD reached the 1.29100 level of significance before a turn down by the bulls occurred. This, however, gave room for the bears to wiggle with the price strength.
USDCAD levels of price influence dropped lower to old zones as the bears settled price movement back to the 1.22800 price level. However, the bulls took control of the price market following a test at the 1.22800 level. The market then improved to flow back in an uptrend direction before a restraint was caused by the bears around the 1.25900 price level. After this pullback, the price is expected to amass more strength and even break through the 1.29110 significant level. But if the buyers fail to push the price up, the market will turn in the bears’ favor.
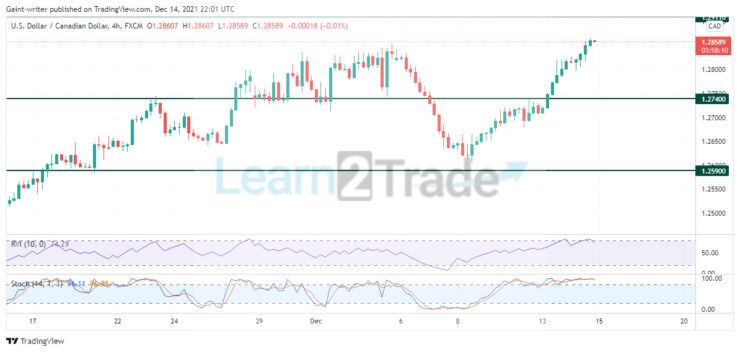
USDCAD Short Term Trend: Bullish
The 4-hour chart shows a strong rallying upward after the bears have succeeded in causing a restraint in price movement upward. The market will continue its bullish trend after the price retest. As the bullish rally continues towards the 1.29110 significant level, the bears will eventually cause a hold back before the price breaks through the 1.29110 level when the momentum increases. The Stochastic Oscillator and the Relative Volume index show a market in overbought order, showing bear involvement in price to change the direction of the market around the 1.29110 price level.
Note:Learn2.trade is not a financial advisor. Do your research before investing your funds in any financial asset or presented product or event. We are not responsible for your investing results.
Trade on MT4 with Leverage up to 1:500! Trade on MT4 with Leverage up to 1:500!
X
We use cookies to ensure that we give you the best experience on our website. If you continue to use this site we will assume that you are happy with it.