Market Analysis – January 10
USDCAD experiences a bearish breakout after a long period of ascending. The buyers have utilised the bullish trend line multiple times to regain bullish momentum. Finally, the Bears appear to have seized control of the market.
USDCAD Key Zones
Resistance zones: 1.370, 1.390, 1.410
Support Zones: 1.330, 1.290, 1.250
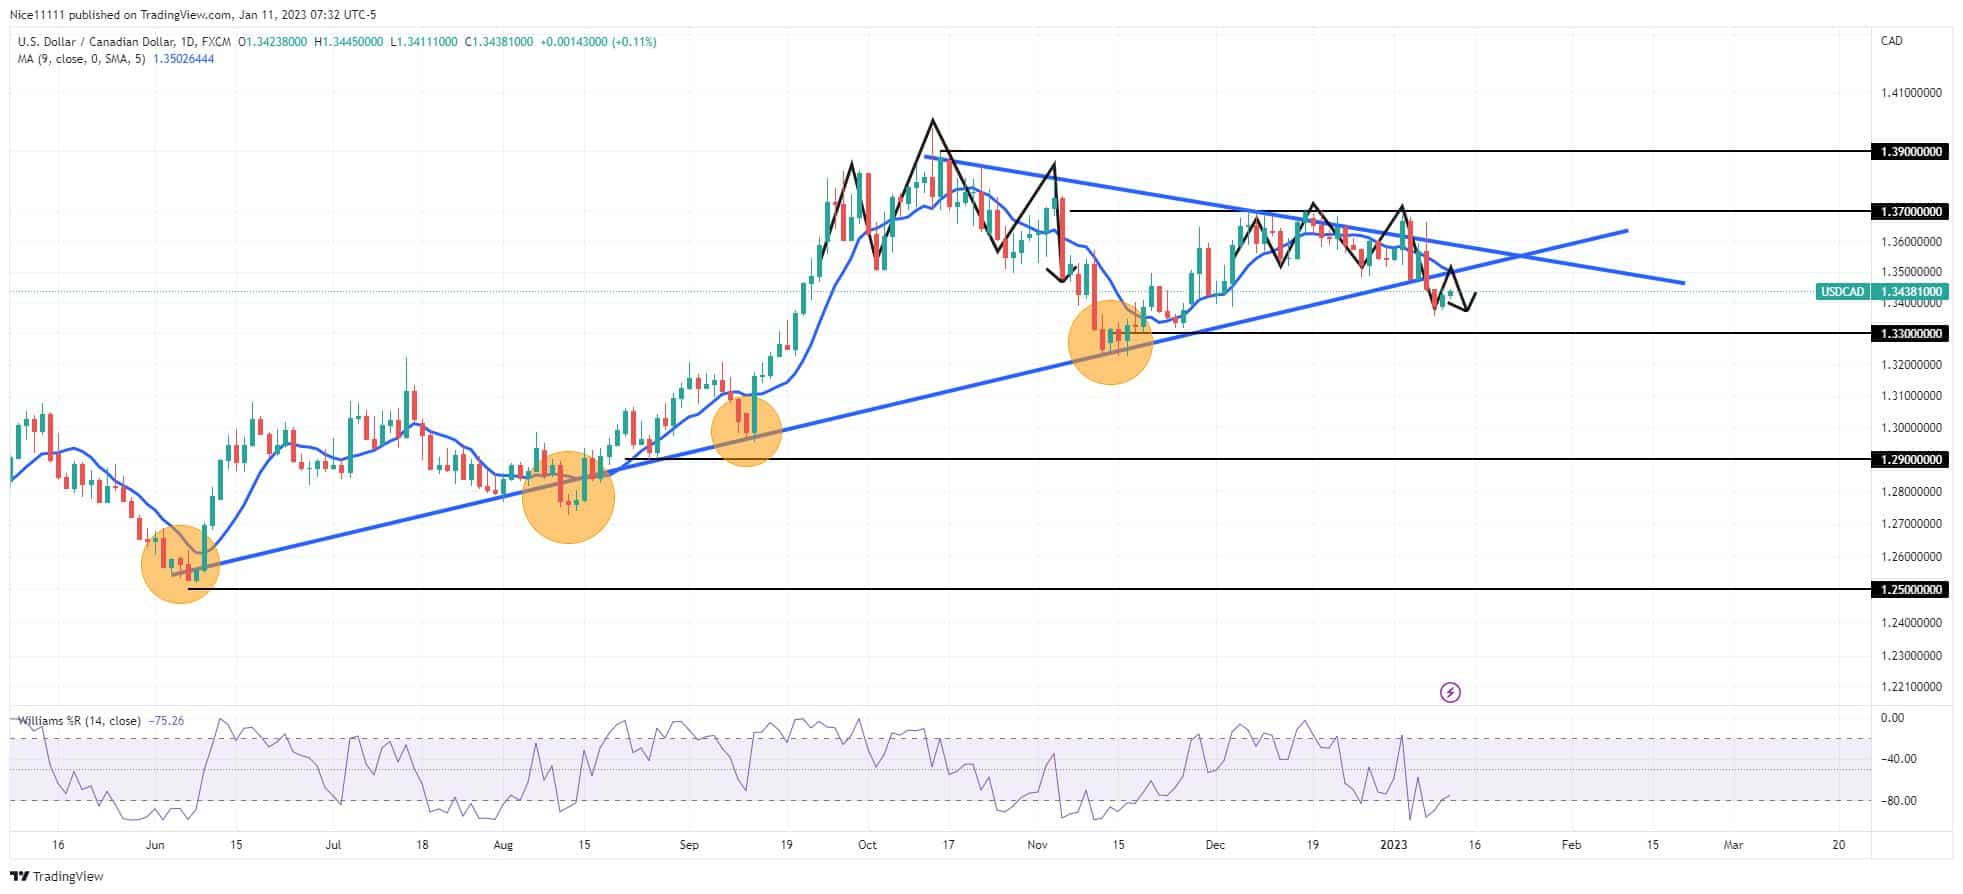
USDCAD Long-term Trend: Bearish
The sellers have displayed their dominance through the breakout from the symmetrical triangle. In June, the Bulls took off from an overbought region. Three White Soldiers led the market from the oversold region. On the daily chart, the bullish trend line was anchored by the corresponding lows formed by the lower highs. The month of September was very bullish. The Williams Percent Range rested in the overbought region.
A head and shoulders pattern formed after the market reached 1.390. The daily candles have fallen below the moving average period nine, indicating a bearish trend. The market bounced off the ascending trendline but failed to create a new (higher) high. A new head-and-shoulders pattern formed at 1.370. The Williams Percent Range indicates the market was well overbought. The sellers drove the market beyond the supporting trend line.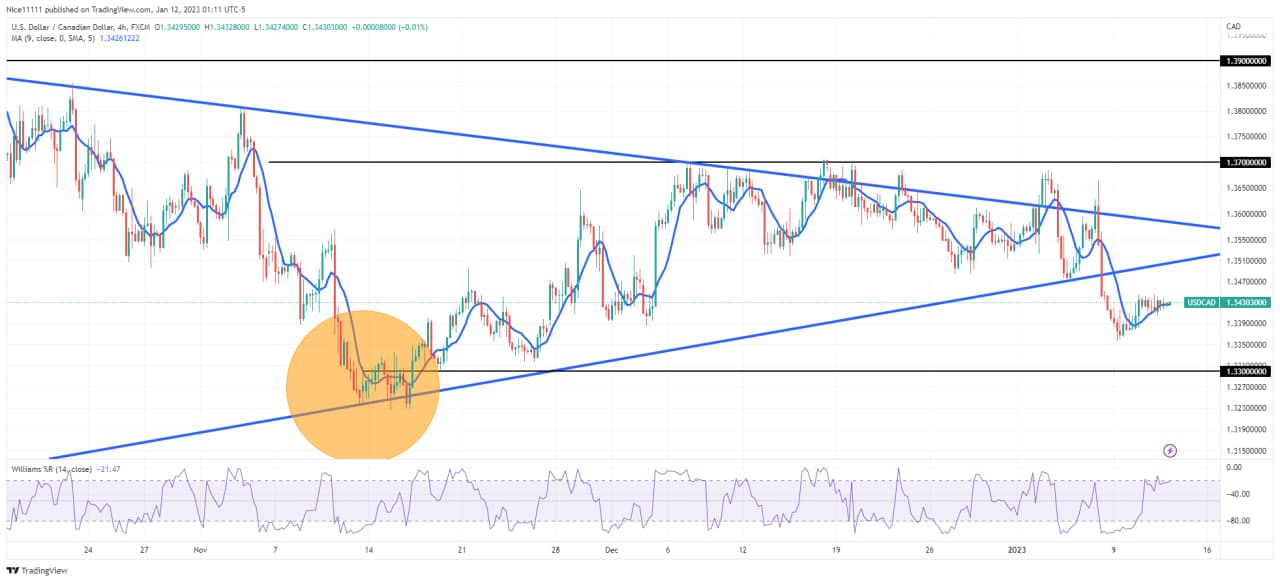
USDCAD Short-term Trend: Bearish
The price is likely to decline to the lower support level of 1.330. The Williams Percent Range is oversold on the 4-hour chart. The retest of the ascending trendline is expected to aid the selloff towards the support zone.
Do you want to take your trading to the next level? Join the best platform for that here
- Broker
- Min Deposit
- Score
- Visit Broker

- Award-winning Cryptocurrency trading platform
- $100 minimum deposit,
- FCA & Cysec regulated

- 20% welcome bonus of upto $10,000
- Minimum deposit $100
- Verify your account before the bonus is credited
- Fund Moneta Markets account with a minimum of $250
- Opt in using the form to claim your 50% deposit bonus
Learn to Trade
Never Miss A Trade Again

Signal Notification
Real-time signal notifications whenever a signal is opened, closes or Updated

Get Alerts
Immediate alerts to your email and mobile phone.

Entry Price Levels
Entry price level for every signal Just choose one of our Top Brokers in the list above to get all this free.