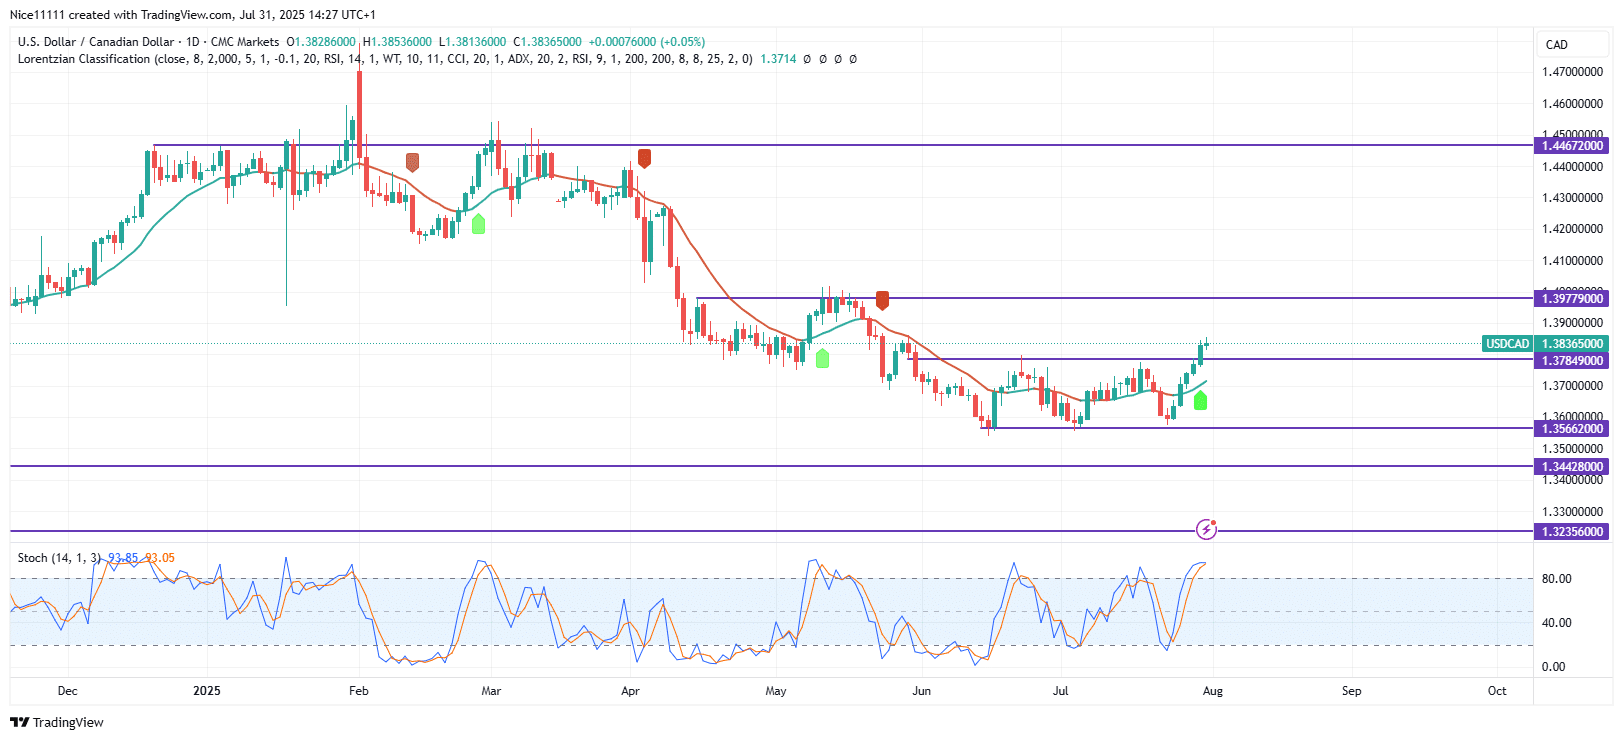
USDCAD reached the support level of 1.35660, where the previous downward trend came to a halt. Following the formation of a triple bottom pattern, the price rebounded strongly, breaking above the resistance level of 1.37850 and thereby confirming a bullish shift in market direction.
After the initial test of the 1.35660 support level, the price surged upward, breaking above the last swing high that had formed prior to reaching the support. Shortly after, the price retraced and dipped back to test the support once again. This cycle repeated itself, causing the market to range between the resistance at 1.37850 and the support at 1.35660.
During this consolidation phase, the Stochastic Oscillator oscillated between overbought and oversold zones as price repeatedly tested the limits of the defined range. A cluster of bullish daily candles followed the most recent test of the support level, culminating in a strong breakout above 1.37850. Notably, at the time of this final test, the market had entered an oversold condition. The breakout was further confirmed by a buy signal generated from the machine-learning-based Lorentizan Classification Indicator.
USDCAD Short-term Trend: Bullish
On the 4-hour chart, the trend remains decisively bullish. Price action is characterized by a sequence of impulsive upward moves followed by healthy retracements. The presence of Fair Value Gaps (FVGs) within the trend underscores the strength and momentum driving the price higher. Traders seeking forex signals to enter long positions may find optimal entry points during pullbacks, aligning their trades with the prevailing bullish structure.
Trade on MT4 with Leverage up to 1:500! Trade on MT4 with Leverage up to 1:500!
X
We use cookies to ensure that we give you the best experience on our website. If you continue to use this site we will assume that you are happy with it.

 USDCAD Short-term Trend: Bullish
 USDCAD Short-term Trend: Bullish


