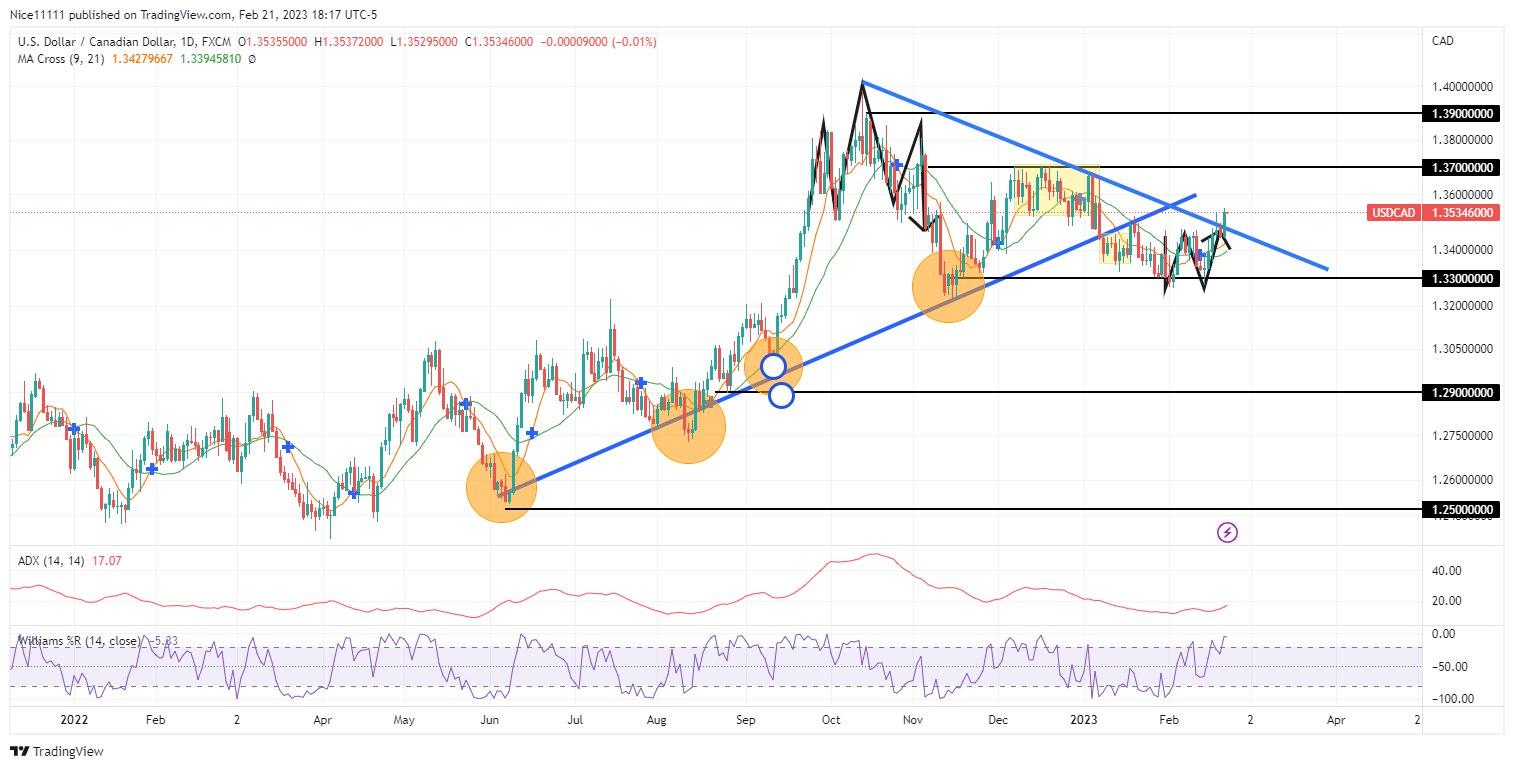
USDCAD used the supporting trendline to ascend from 1.250 to 1.390. The uptrend witnessed its most energetic move in October, when the ADX (Average Directional Index) rose above 40. A bearish reversal followed the aggressive rise in price. A bearish structural pattern played out at the 1.380 supply level. This fostered a bearish displacement to 1.330. The market found support on the bearish trendline. After a bounce of the trendline, the bears struck from the supply level at 1.370 to violate the ascending trendline.
The second test at 1.330 failed to break through the significant level. The demand level of 1.330 is well protected. The bulls are launching from the support level. A double bottom reversal pattern has formed at the support region of 1.330.0. The bearish trendline is already giving way to the emergence of the bulls. The ADX (Average Directional Index) currently signifies a weak bearish trend.
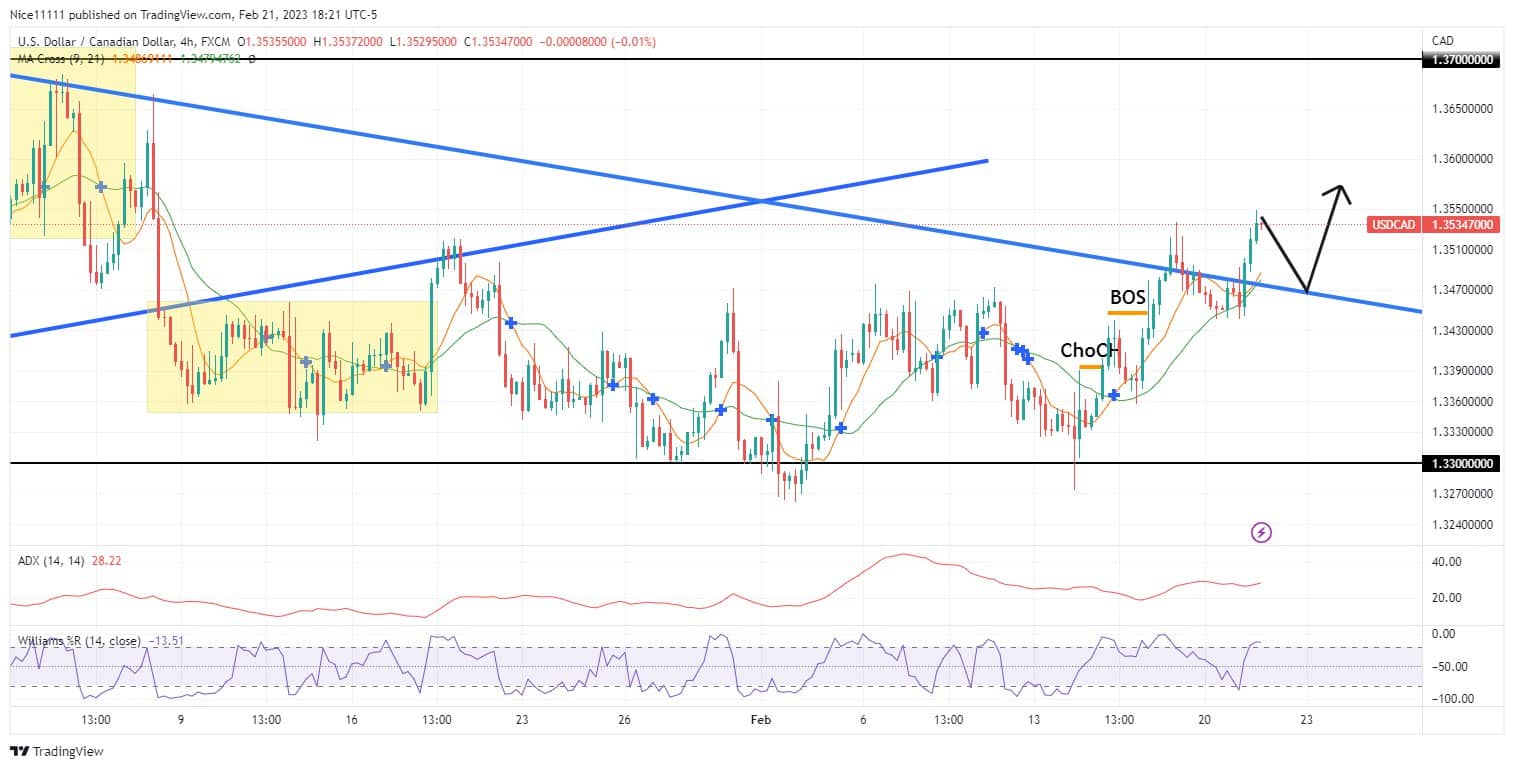
USDCAD Short-term Trend: Bullish
In the market, a break and retest of the bearish trend-line is expected. On the lower timeframe, the market has seen a bullish break of structures (BOS). The market is expected to drive to a 1.370 supply level if the breakout plays out successfully.
Trade on MT4 with Leverage up to 1:500! Trade on MT4 with Leverage up to 1:500!
X
We use cookies to ensure that we give you the best experience on our website. If you continue to use this site we will assume that you are happy with it.