
Key Resistance Levels: 0.9400, 0.9500, 0.9600
Key Support Levels: 0.9100, 0.9000, 0.8900
USD/CHF Price Long-term Trend: Bullish
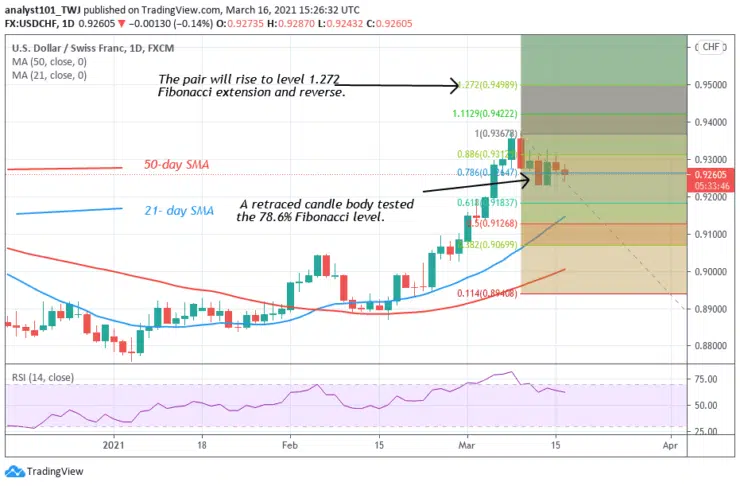
The pair is presently in an upward move. The pair is falling after rejection from the recent high. On March 9, a retraced candle body tested the 78.6% Fibonacci level. This retracement indicates that the market will rise to level 1.272 Fibonacci extension and reverse. That is the high of level 0.9498.
Daily Chart Indicators Reading:
The pair has fallen to level 63 of the Relative Strength Index period 14. It implies that the price is in the uptrend zone. The price has room to rally on the upside. The 50-day SMA and 21-day SMA are sloping upward indicating an uptrend.
USD/CHF Medium-term Trend: Bearish
On the 4-hour chart, the pair is in a downward move. On March 9 downtrend; a retraced candle body tested the 78.6% Fibonacci retracement level. The retracement indicates that the price will fall to level 1.272 Fibonacci extensions or the low of level 0.9242. The current downtrend has reached bearish exhaustion.


