
Key Resistance Levels: 1.4200, 1.4400, 1.4600
Key Support Levels: 1.3400, 1.3200, 1.3000
USD/CAD Price Long-term Trend: Bearish
USD/CAD pair is in a bullish moventum for the past three days. The currency pair has been rising on the upside. Buyers have broken above the moving averages. However, the uptrend is facing resistance at level 1.2600. The implication is that the major bearish trend is likely to resume.
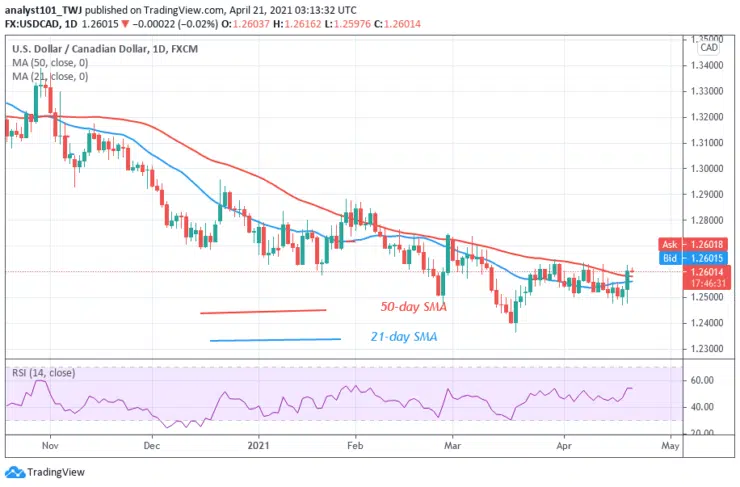
Daily Chart Indicators Reading:
The 21-day SMA and 50-day SMA are sloping downward indicating the downtrend. USD/CAD is at level 54 of the Relative Strength Index period 14. It indicates that the pair is in the uptrend zone and it is capable of rising.
USD/CAD Medium-term Trend: Bullish
On the 4-hour chart, the pair is rising on the upside. The current uptrend is facing resistance at level 1.2620. On April 20 uptrend; a retraced candle body tested the 88.6% Fibonacci retracement level. The retracement indicates that USD/CAD will rise to level 1.1129 Fibonacci level or the high of 1.2638. From the price action, the market is fluctuating below the resistance level.


