Key Support Levels: 1.34000, 1.32000, 1.30000
USD/CAD Price Long-term Trend: Bearish
The USD/CAD was earlier in a sideways trend before its sudden rise in March. The bull market reached level 1.46503 and price was said to be in the overbought region. Sellers emerged as price fell to 1.38626 low. There was a downward correction to the high of level 1.42650. The selling pressure resumed as the market fell to level 1.39367 low. The downtrend is likely to continue.
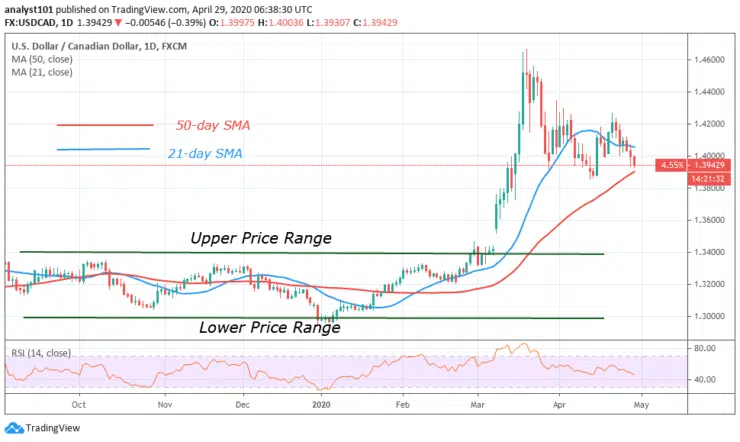
Daily Chart Indicators Reading:
As a result of the downtrend, the market is at level 48 of the relative strength index. This indicates that the pair is in the downtrend and also below the center line 50. There is a possibly drop in the currency pair.
USD/CAD Medium-term Trend: Bearish
On the 4-hour chart, the pair is in a bear market. A Fibonacci tool is used to determine the extent of the downward move. A candle body is testing the 0.382 Fibonacci retracement level. According to the bull candle at 0.382 retracement level, the market is likely to reverse at 1.618 Fibonacci extension level. In other words, price will reverse at level 1.38000. From the price action, the market has reversed but the downtrend is continuing to reach the Fibonacci extension level.
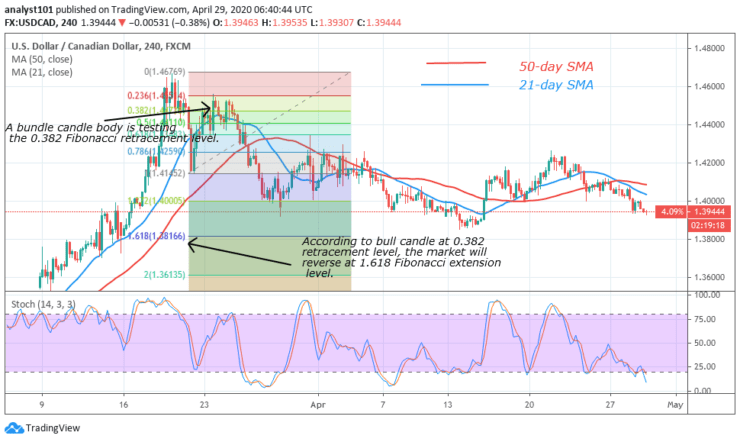
4-hour Chart Indicators Reading
Presently, the 21-day SMA and 50-day SMA are sloping horizontally indicating the earlier sideways move. Also, the market is below 20% range of the daily stochastic. This implies that the market is approaching the oversold region. In the oversold region, buyers are likely to emerge. Meanwhile, the market is in a bearish momentum.
General Outlook for USD/CAD
In the meantime, the pair is falling and approaching the oversold region. It is likely price will reach level 1.38000 which is the reversal price level of the Fibonacci tool. Perhaps, buyers may come in at the Fibonacci extension level.
Note: Learn2Trade.com is not a financial advisor. Do your research before investing your funds in any financial asset or presented product or event. We are not responsible for your investing results
- Broker
- Min Deposit
- Score
- Visit Broker

- Award-winning Cryptocurrency trading platform
- $100 minimum deposit,
- FCA & Cysec regulated

- 20% welcome bonus of upto $10,000
- Minimum deposit $100
- Verify your account before the bonus is credited
- Fund Moneta Markets account with a minimum of $250
- Opt in using the form to claim your 50% deposit bonus
Learn to Trade
Never Miss A Trade Again

Signal Notification
Real-time signal notifications whenever a signal is opened, closes or Updated

Get Alerts
Immediate alerts to your email and mobile phone.

Entry Price Levels
Entry price level for every signal Just choose one of our Top Brokers in the list above to get all this free.