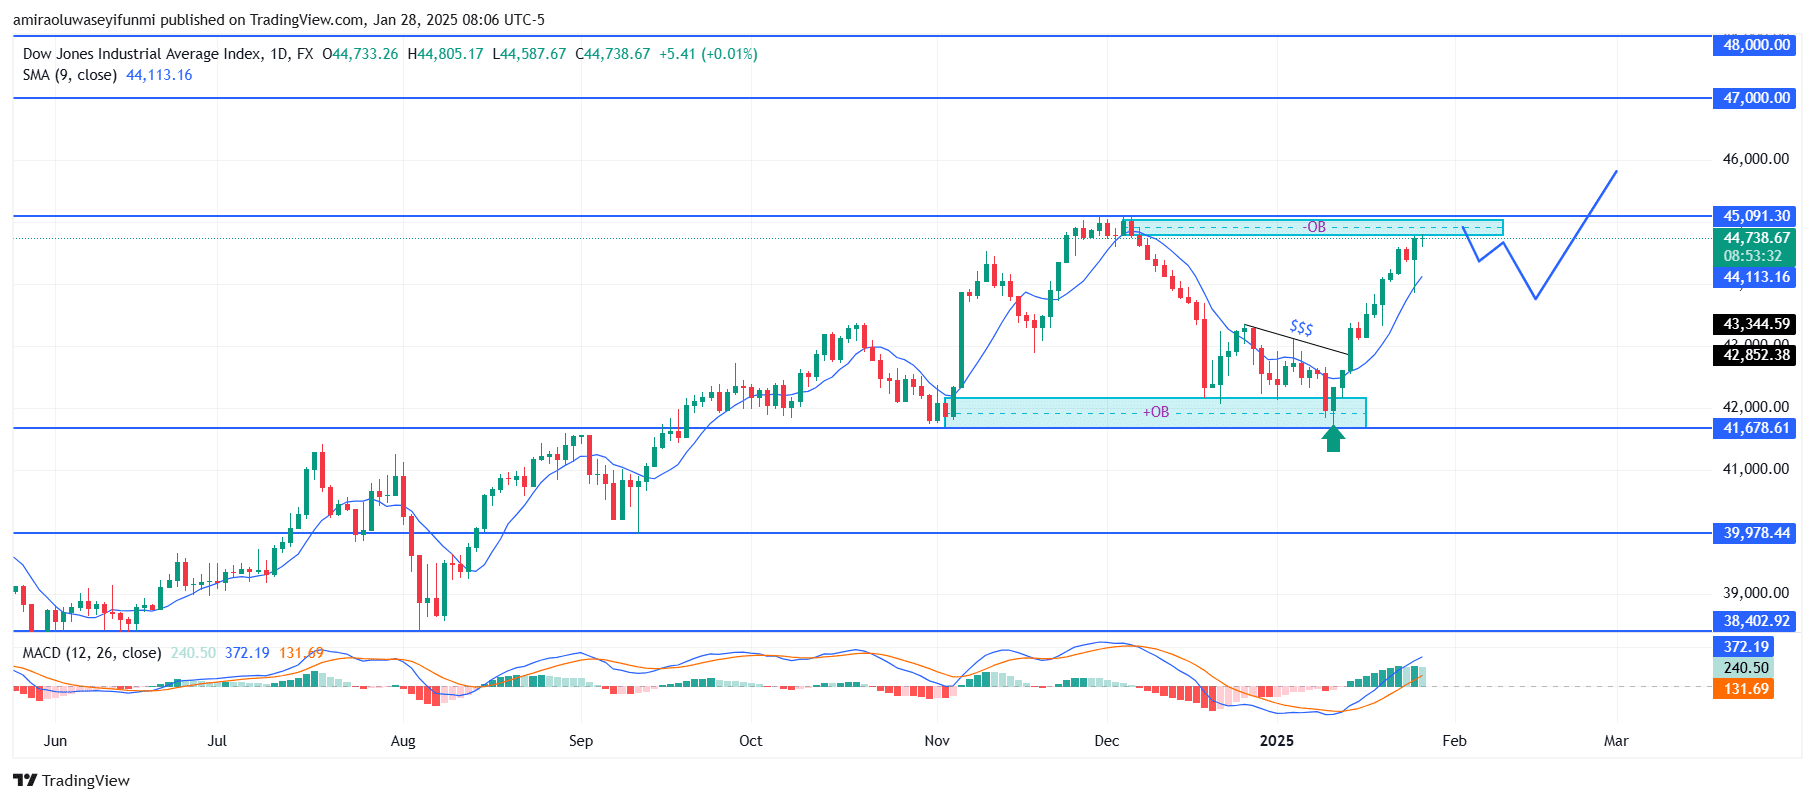
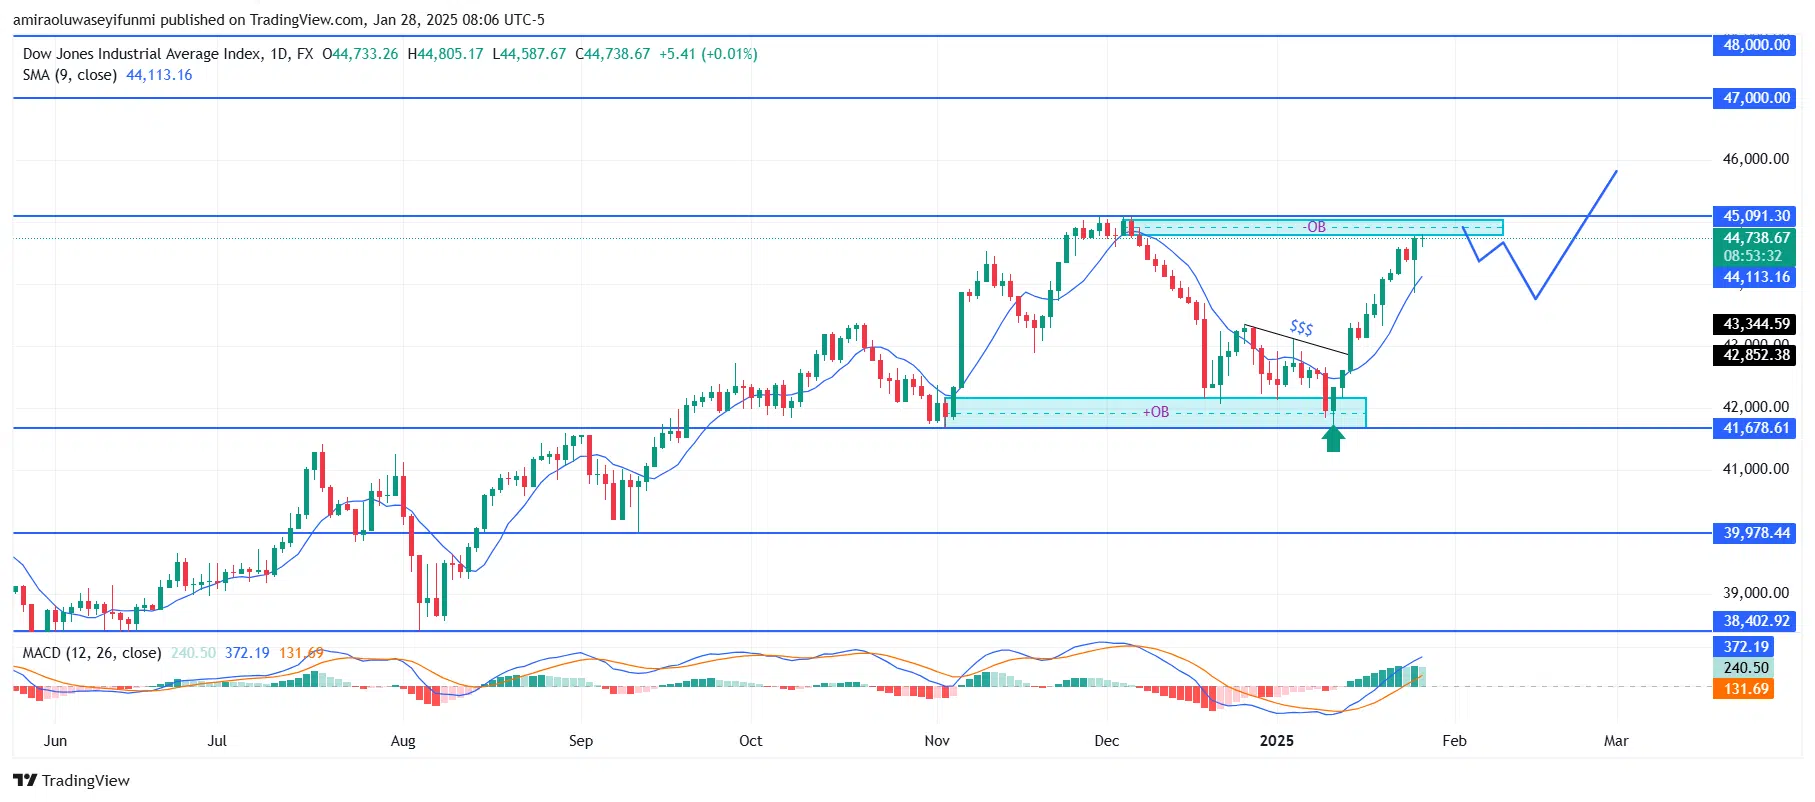
US30 continues to display strong bullish momentum with increasing potential. Key technical indicators support this upward trend. The price is currently above the 9-day Simple Moving Average (SMA) at $44,110, signaling a sustained uptrend. The MACD remains in positive territory, with the MACD line crossing above the signal line and an expanding histogram, reinforcing strong buying pressure and positive market sentiment.
US30 Key Levels
Resistance Levels: $45,100, $47,000, $50,000 Support Levels: $41,700, $40,000, $38,400
US30 Long-Term Trend: Bullish
On the chart, the price has broken above the previous bearish structure at the $42,850 resistance level, which has now turned into support. A bullish order block near $41,680 was successfully defended, leading to a sharp upward movement. The market is approaching a significant resistance zone around $45,100, which corresponds with a bearish order block from a prior consolidation phase. This area may see a temporary retracement before the next upward push.
Looking ahead, the outlook remains bullish as the price gains momentum above $44,740. A brief pullback to retest the $44,110 support level could serve as a launchpad for further gains. A break above $45,100 could pave the way for a move toward $47,000 and ultimately $48,000, marking the next major resistance zone.
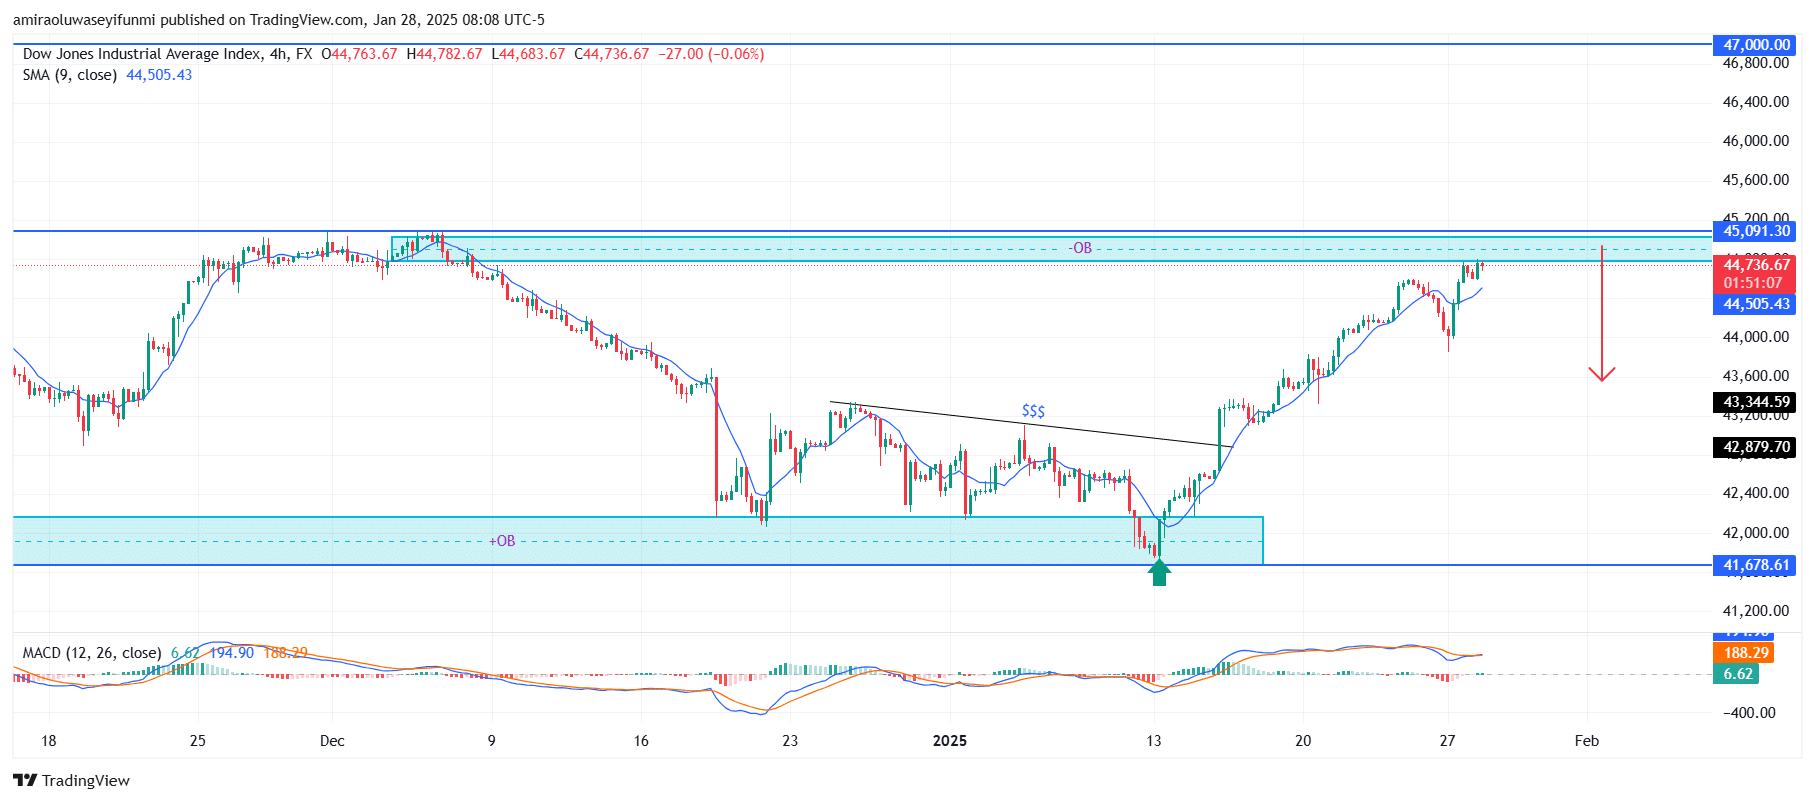
US30 Short-Term Trend: Bearish
In the short term, US30 continues to demonstrate strong bullish momentum, with prices trading above the 9-day and 21-day moving averages at $43,960 and $43,700, respectively. A notable change in market structure around $42,000 confirms the transition from bearish to bullish dominance. The index has surpassed the $43,110 resistance level and is advancing toward $45,100, the next key resistance point. The RSI at 79.70 indicates overbought conditions, suggesting a possible correction before further upward movement.
The market’s bullish trajectory remains strong, with traders closely watching for potential pullbacks that could offer new entry opportunities. With forex signals providing additional insights, investors continue to monitor key resistance and support levels for strategic decision-making.
Note: Learn2.trade is not a financial advisor. Do your research before investing your funds in any financial asset, product, or event. We are not responsible for your investment results.
Trade on MT4 with Leverage up to 1:500! Trade on MT4 with Leverage up to 1:500!
X
We use cookies to ensure that we give you the best experience on our website. If you continue to use this site we will assume that you are happy with it.