

US30 Analysis – March 4
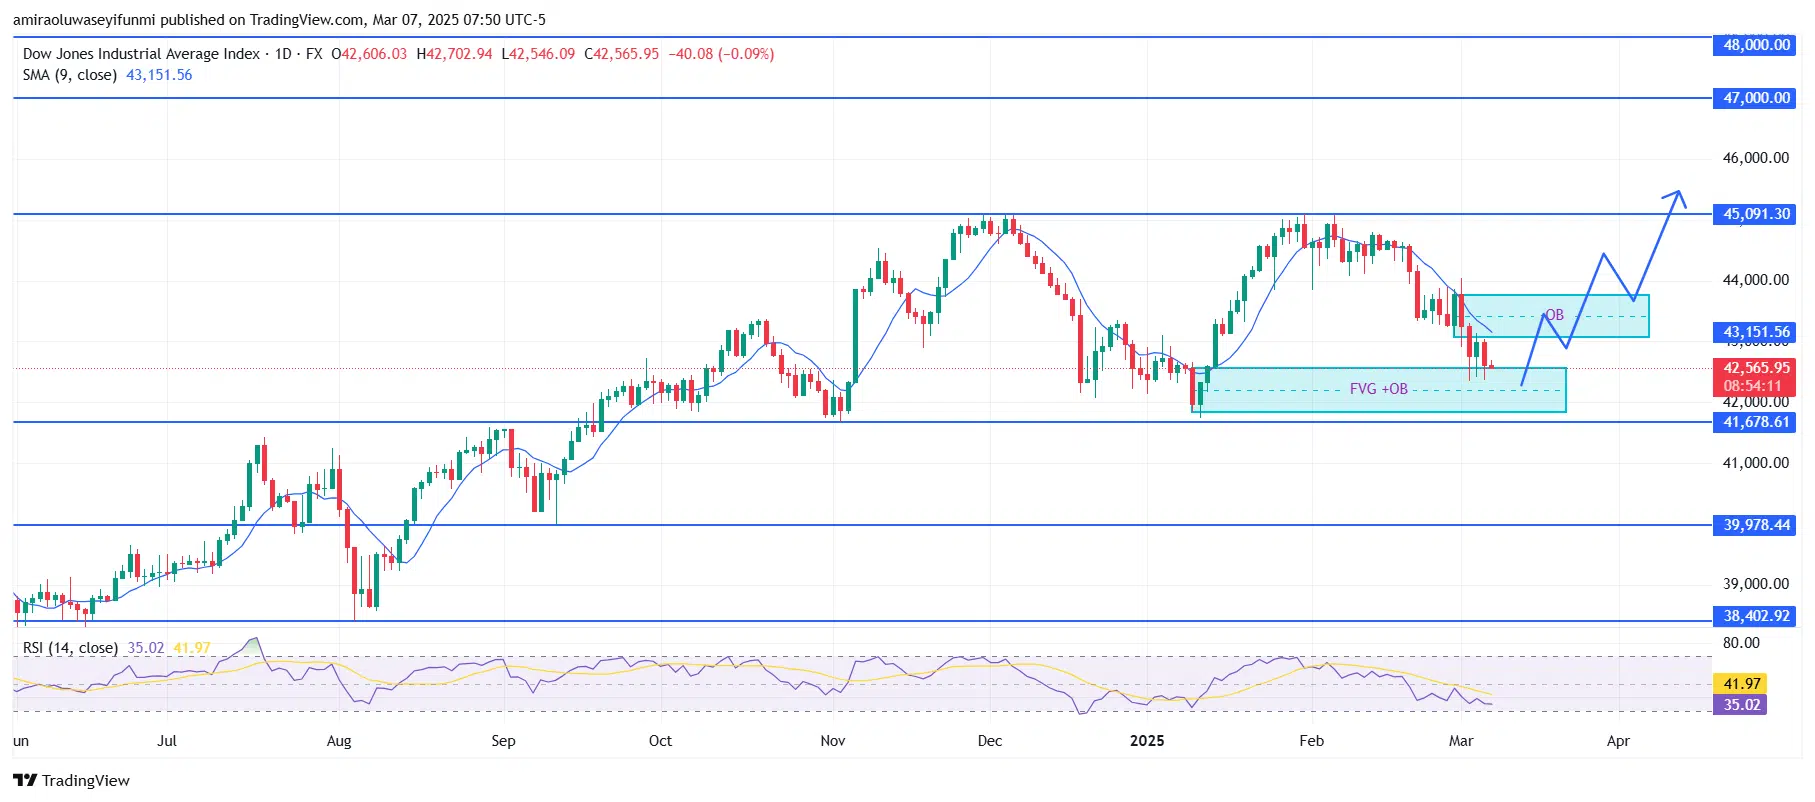
US30 demonstrates bullish potential after maintaining a critical support level. Indicators suggest a strong possibility of a bullish reversal. The 9-period Simple Moving Average (SMA) at $43,150 indicates that the market remains in a short-term downtrend; however, the price is currently rebounding from a demand zone. The Relative Strength Index (RSI) stands at 35.00, close to the oversold territory, signaling that selling pressure may be weakening, allowing buyers to step in. A bullish divergence between the RSI and price could further reinforce the case for an upward movement.
US30 Key Levels
Resistance Levels: $45,100, $47,000, $48,000
Support Levels: $41,700, $40,000, $38,400
US30 Long-Term Trend: Bullish
US30 Short-Term Trend: Bullish
With the 9-period SMA at $42,620 acting as immediate resistance, the US30 is currently trading near a crucial support level at $42,160. The RSI at 39.80 indicates that the market is approaching oversold conditions, increasing the likelihood of a bullish reversal. A decisive breakout above $42,620 could signal a move toward the $45,100 resistance level. The bullish sentiment, aiming for higher levels in the coming sessions, remains valid as long as the price stays above $41,700. Additionally, traders may consider forex signals to capitalize on potential market movements.
Make money without lifting your fingers: Start using a world-class auto trading solution
How To Buy Lucky Block
Note: Learn2.trade is not a financial advisor. Do your research before investing your funds in any financial asset, product, or event. We are not responsible for your investment results.


