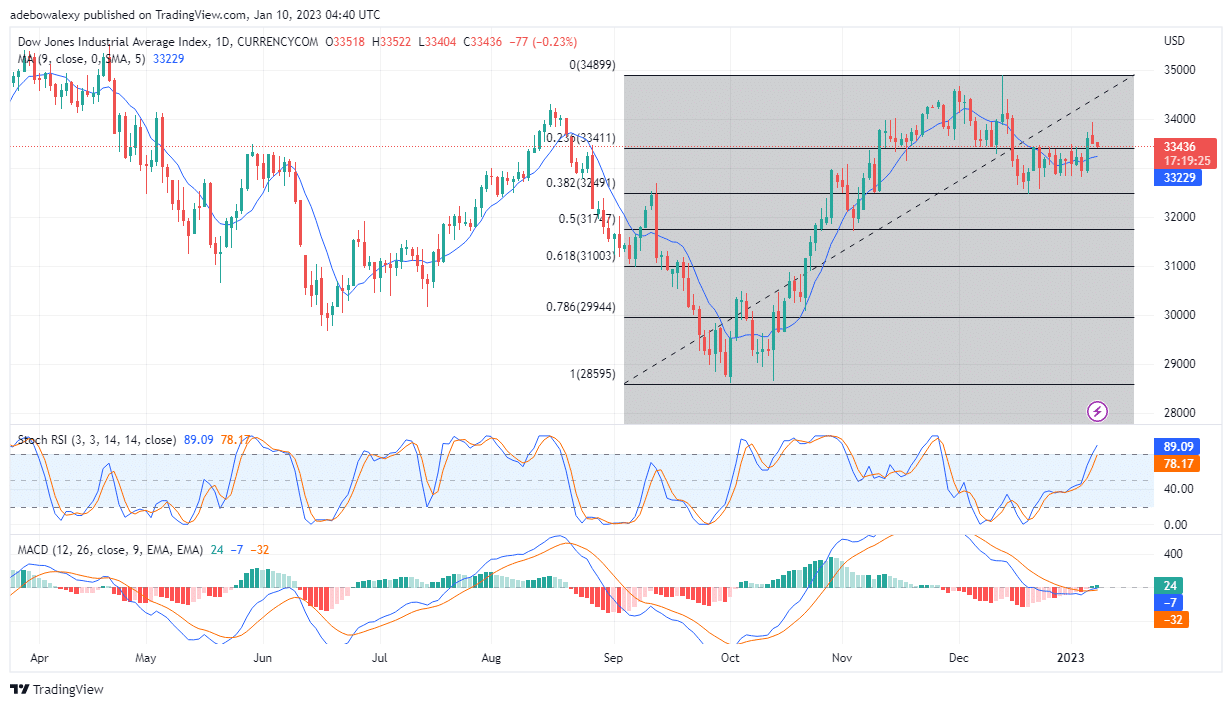
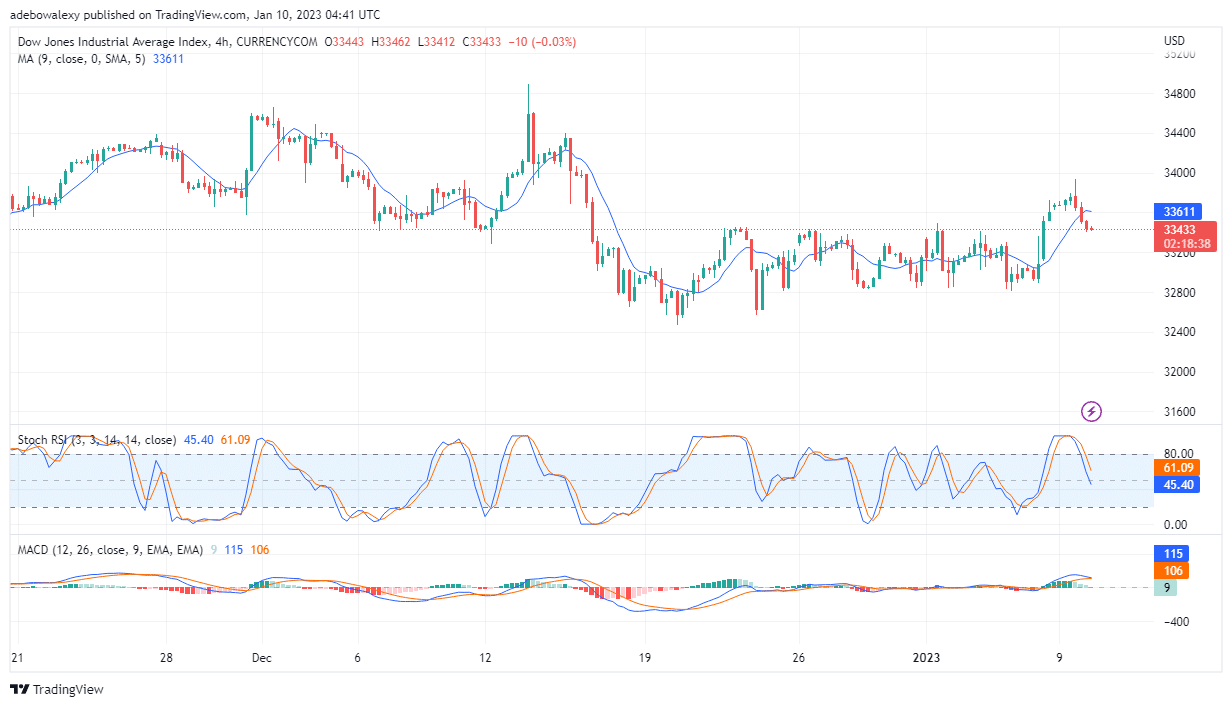
US30 price action received a significant upside push last Friday. However, the market opened for the week attracting the attention of bears. Subsequently, this has caused prices to keep falling toward the support level of $33,411. In today’s session, prices may likely break this support level to reach lower.
Major Price Levels:
Top Levels: $33,441, $33,500, $33,560
Floor Levels: $33411, $33,388, $33,350

US30 Price Action and Technical Indicator Stays Divergent
Price activities on the US30 daily market are now trickling down towards an important support level, that aligns with the Fibonacci level of 23.60. Also, the price candle representing today’s trading session is almost bringing the market to the above-mentioned price mark. Nevertheless, technical indicators are revealing that the price is still on its way up. The lines on the Stochastic RSI are rising into the overbought region and nearly reaching the 90 mark. Furthermore, the histogram bars on the MACD are now green and forming above the 0.00 mark to indicate a developing upsurge in price. Nevertheless, it is expedient that traders carry out further checks on price action before making trading decisions at this point.

US30 May Have Started a Downtrend
Examining US30 price activities on the 4-hour chart, it could be seen that price candles have fallen below the Moving Average curve. Technically, such a display indicates that the price is in a downtrend. Furthermore, the Stochastic RSI shares the same opinion. This could be observed as the lines of this indicator are now coursing towards the oversold region. Likewise, the MACD indicator is now about to give a crossover to indicate the resumption of downward forces. Consequently, the 4-hour chart is revealing that the price may continue to fall lower as trading activities continue. Therefore, traders can predict that the price may fall to nearly $33,350.
Do you want to take your trading to the next level? Join the best platform for that here.
- Broker
- Min Deposit
- Score
- Visit Broker
- Award-winning Cryptocurrency trading platform
- $100 minimum deposit,
- FCA & Cysec regulated
- 20% welcome bonus of upto $10,000
- Minimum deposit $100
- Verify your account before the bonus is credited
- Fund Moneta Markets account with a minimum of $250
- Opt in using the form to claim your 50% deposit bonus
Learn to Trade
Never Miss A Trade Again

Signal Notification
Real-time signal notifications whenever a signal is opened, closes or Updated

Get Alerts
Immediate alerts to your email and mobile phone.

Entry Price Levels
Entry price level for every signal Just choose one of our Top Brokers in the list above to get all this free.


